Research project
Making Food Better Tracker Survey 2023
Northern Ireland specific
The Making Food Better Tracker Survey measures the progress of the FSA’s Making Food Better programme in Northern Ireland through the collection of robust consumer insights and the monitoring of this data over time. The survey collects information on consumer perceptions of healthy eating, healthier options and reformulation, the use of traffic light labels, knowledge and understanding of the recommended daily calorie intake and attitudes towards promotions.
Northern Ireland
Northern Ireland
Northern Ireland
Executive Summary
Key findings at a glance
- A total of 601 interviews were completed between 4th September and 22nd November 2023 using Computer Assisted Personal Interviewing (CAPI). Quotas were set on gender, age, socio-economic group and region.
- Women (25%) have greater knowledge of their recommended daily calorie intake than men (15%) but general awareness is low among all consumers.
- The primary source of nutritional information for consumers is nutritional claims on packaging (32%), however, 41% disregard this information while shopping.
- Traffic light labelling is recognised by the majority (93%) of consumers but only 43% actively use it. The main use of traffic light labelling is to assess sugar, salt, and fat content in products.
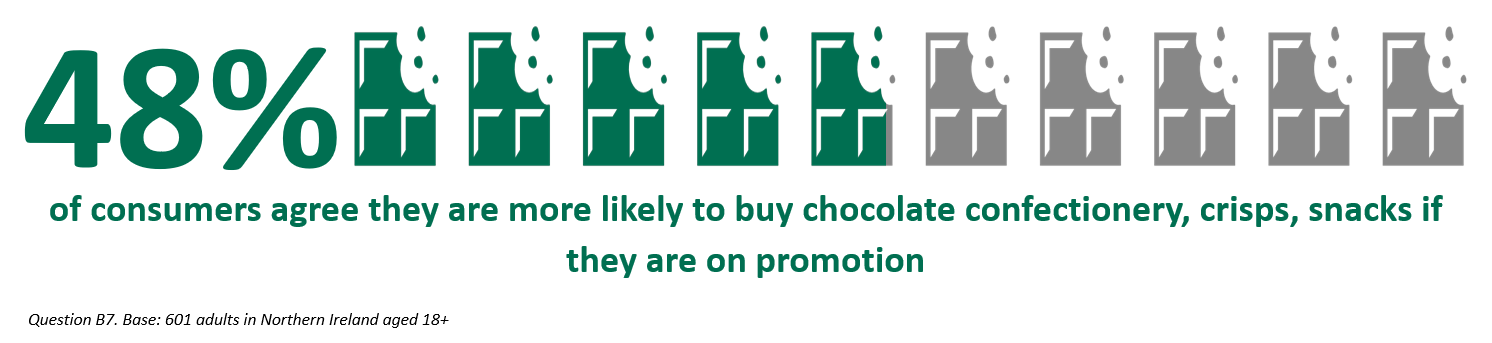
- Promotions influence consumer purchasing behaviours, with 48% more likely to buy chocolate confectionery, crisps and snacks if they are on promotion.
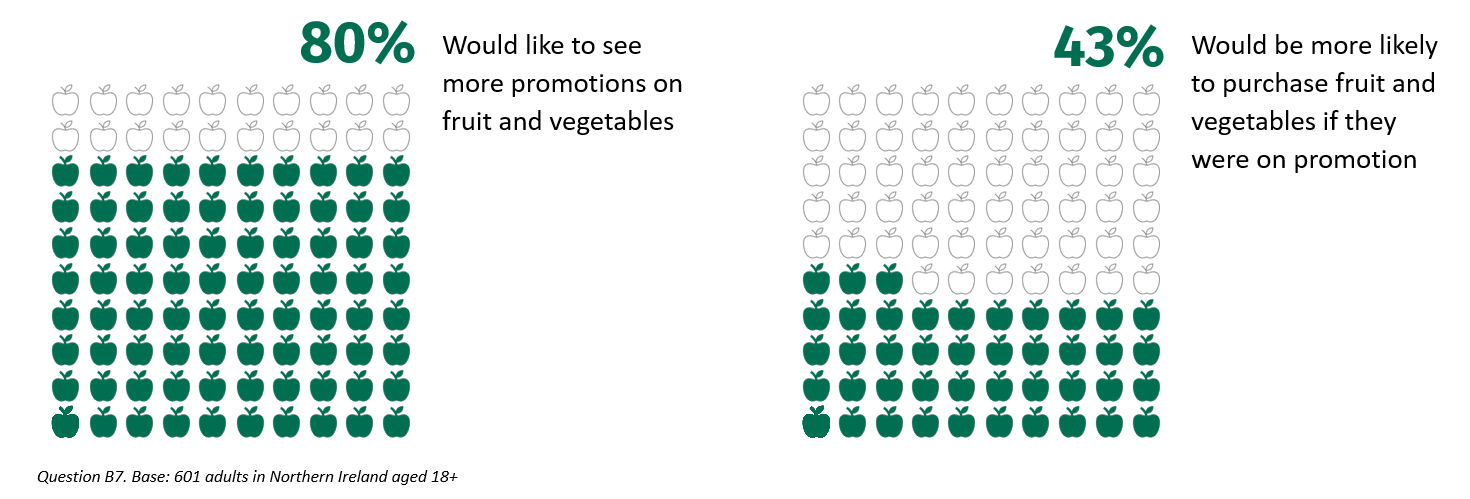
- The majority (80%) of consumers would like to see more promotions on fruit and vegetables, yet only 43% say they would purchase them if they were on promotion.
- Consumers struggle with choosing healthier food when eating out, particularly at takeaways (74%), fast-food restaurants (64%), and places of leisure such as cinemas (60%).
Key Demographic findings
Gender
- More women (68%) claim to choose healthier foods while shopping and when eating out (29%) compared to men (55% and 21%, respectively).
- Women (48%) are more likely to use traffic light labels than men (37%) and understand their purpose (83% vs 75%).
- More men (32%) are opposed to seeing reformulated foods and smaller portion sizes than women (20%).
Socio-economic background
- Those from higher socio-economic groups found it easier to choose healthier food in store at supermarkets compared to those from lower socio-economic groups (80% vs 62%).
- Those from higher socio-economic groups show increased awareness (96%), usage (52%), and understanding (89%) of traffic light labelling compared to those from lower socio-economic groups (90%, 34%, and 71% respectively).
Age
- Those between the ages of 25-54 (51%) are more inclined to use the traffic light system than those aged 18-24 (30%) and over 55 (35%).
- Those under 55 years of age (63%) are more likely to purchase chocolate confectionary, crisps and snacks if they are on promotion compared to those aged 55 and over (25%).
Background and Methodology
Background
This report presents the findings from the Food Standards Agency’s (FSA) 2023 Making Food Better (MFB) Tracker Survey in Northern Ireland (NI). The FSA rebranded its Eating Well Choosing Better (EWCB) programme to MFB in 2023, however, the MFB Tracker Survey is regarded as a continuation of the EWCB Tracker Survey.
The survey measures the progress of the FSA’s Making Food Better programme in NI through the collection of robust consumer insights and the monitoring of this data over time.
Methodology
- All surveys were completed using Computer Assisted Personal Interviewing (CAPI) across households in NI.
- A total of 601 interviews were completed in 2023.
- To ensure representation of the population of NI, quota sampling was adopted. Quotas on gender, age, socio-economic group and regions were derived from the latest Census 2021 population statistics (Census Office for Northern Ireland, 2021). In 2022 and 2021, quotas were derived from the 2011 Census statistics.
- In 2022 and 2023 data was weighted to the target for each demographic grouping. No weighting was applied in 2021.
- Fieldwork was conducted between 4th September 2023 and 22nd November 2023.
Results
Women have greater knowledge of their recommended daily calorie intake than men
There is scope for greater education on calorie requirements among the NI population as knowledge of the recommended daily calorie intake was poor among females and males - 25% of women and 15% of men correctly identified the recommended daily calorie intake for their gender.
Most consumers shop for food in store at a supermarket
Most consumers in NI continue to favour supermarkets as their primary food shopping source (80%), but there has been a shift between 2022 and 2023.
- Supermarket usage fell from 88% to 80%.
- Conversely, independents like greengrocers, butchers and bakers saw an increase, rising from 32% to 41%.
- Local/ corner shop, newsagents or garage forecourt usage fell from 56% to 52%
Online from a supermarket, including home delivery and click and collect, fell from 15% to 12%
There was a slight increase from market/ farmer's market/ farm shop from 6%to 7%
Usage of home delivery not from a supermarket, e.g. Deliveroo, Hello Fresh, fell from 4% to 2%
When shopping in store, almost one third look at nutrition claims on the pack to find out nutritional information of products
The leading source of nutritional information for consumers is nutritional claims on pack, which 32% of consumers look at.
Examples of nutrition claims that consumers may look for on product packaging include 'low sugar', 'low fat', 'high in fibre’.
However, 41% do not look at the nutritional information of products when food shopping in store.
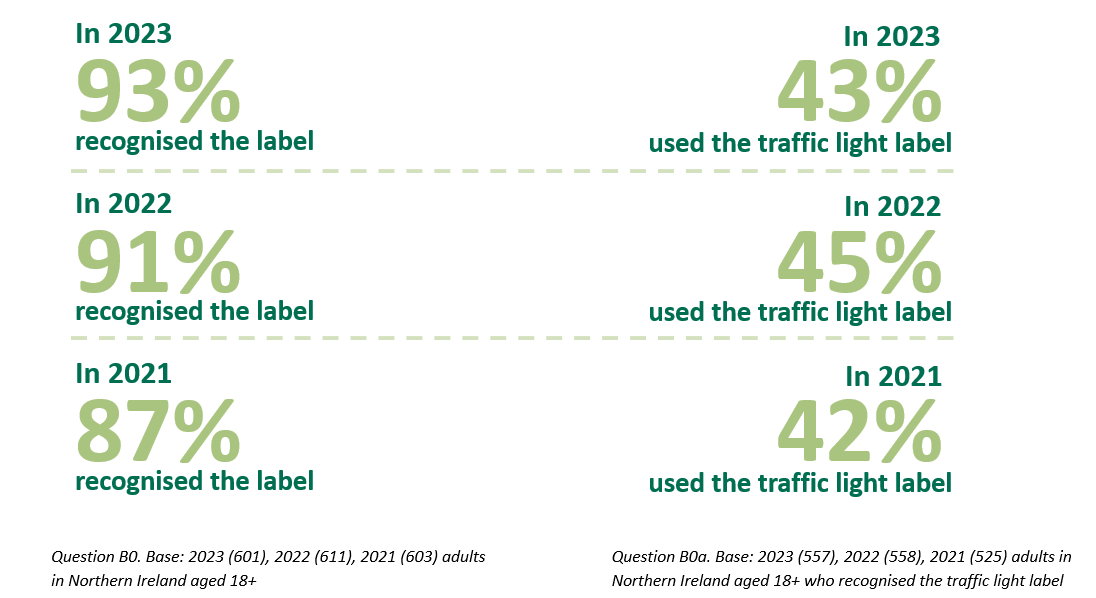
Although most consumers recognise the traffic light label, less than half use it when shopping for food
Image 1. Traffic light label
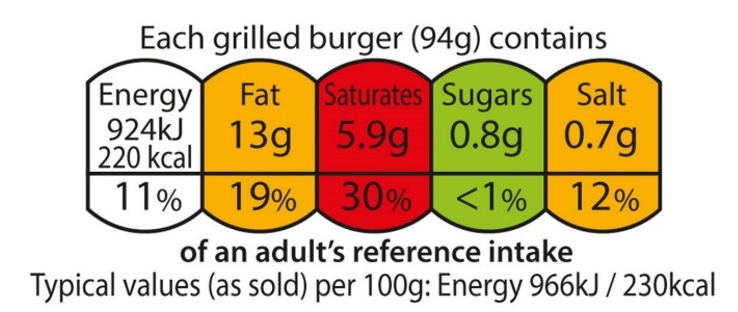
Figure 4. Recognition and usage of the traffic light label
Consumers have a good understanding of the traffic light label and mostly use it to find out the amount of sugar in foods
Use of traffic light label when food shopping for self and for children
- 65% use traffic light label to understand the amount of sugar in products when shopping for themselves. When shopping for their children, 75% use it to understand the amount of sugar in products.
- 51% use traffic light label to understand the amount of salt in products when shopping for themselves. When shopping for their children, 50% use it to understand the amount of salt in products.
- 47% use traffic light label to understand the amount of fat in products when shopping for themselves. When shopping for their children, 49% use the traffic light label to understand the amount of fat in products.
- 43% look at the calories next to the traffic light label when shopping for themselves. When shopping for their children, 28% look at the calories.
- 39% use traffic light label to understand the amount of saturated fat in products, when shopping for themselves. When shopping for their children, 46% use it to understand the amount of saturated fat in products.
- 10% use traffic light label to find information on portion size, when shopping for themselves. When shopping for their children, 11% use it to find information on portion size.
The traffic light label mainly helps people understand the amount of:
- sugar;
- salt; and,
- fat
in the food products they buy, whether buying for themselves or their children.
Promotions influence what consumers buy
Figure 6. Purchasing of snacks on promotion
Most consumers would like to see more fruit and vegetables on promotion but less than half say they would purchase them if they were on promotion
Figure 7. Promotions on fruit and vegetables
Consumers find it more difficult to choose healthier food when eating out compared to when shopping in supermarkets
Consumers continue to struggle with choosing healthier meals when eating out.
In 2023, the settings in which consumers found it most difficult to choose healthier food were:
- Takeaways (74%);
- Fast-food restaurants (64%); and,
- Places of leisure e.g. cinemas (60%).
Awareness of calories on menus remains low but is increasing
Since 2022, there has been an increase in the number of consumers noticing calorie counts on takeaway (22%) and café menus (16%).
In 2022 and 2023, around half of consumers did not notice calories on food menus in any of the settings; a significant drop from 69% in 2021.
Products reduced in sugar, salt or saturated fat are more appealing to consumers than products with smaller portion sizes or calorie limits
Likelihood of purchasing reformulated products or smaller portion sizes
- Reduced sugar products - 62% are more likely to purchase and 12% are less likely to purchase.
- Reduced salt products - 54& are more likely to purchase and 11% are less likely to purchase.
- Reduced saturated fat products - 51% are more likely to purchase and 12% are less likely to purchase.
- Smaller portion sizes of sugary snacks/ meals - 34% are more likely to purchase and 26% are less likely.
- Smaller portion sizes of snacks/ meals high in salt - 33% are more likely to purchase and 26% are less likely.
- Smaller portion sizes of snacks/ meals high in saturated fat - 30% are more likely to purchase and 26% are less likely.
- Products with a maximum limit on calories - 23% are more likely to purchase and 15% are less likely.
Sub-group analysis
Gender
- Women (61%) were more likely than men (50%) to agree that their personal eating habits are healthy.
- While food shopping, a larger proportion of women (68%) try to choose healthier versions of products in contrast to men (55%). Similarly, when eating out, 29% of women try to choose a healthier option from the menu compared to 21% of men.
- Women (48%) were more likely than men (37%) to report having used the traffic light label when shopping for food and understand the purpose of traffic light labels (83% vs 75%).
- 84% of women would like to see more promotions on fruit and vegetables, compared to 76% of men.
- Men (38%) were more likely than women (25%) to say that they would not like to see healthier products in a range of food settings including restaurants and pubs, vending machines and staff restaurants.
- Men (32%) were more likely to report not wanting to see reformulated food or smaller portion sizes than women (20%).
Age
- Participants aged between 35-54 (94%) were more likely to report shopping for food in a supermarket (including online) compared to those aged under 35 (81%) as well as those 55 and over (80%). Shopping with independent greengrocers, butchers, bakers or fishmongers is most popular among those over 55 (51%).
- Participants aged 25-54 (51%) were more inclined to use the traffic light label system while food shopping than those aged 18-24 (30%) and over 55’s (35%).
- Choosing healthier foods in-store at a supermarket is easier for participants aged 18-54 (76%) than for those aged 55 and over (61%).
- Participants under the age of 55 (63%) are more likely to purchase products such as chocolate confectionary, crisps and snacks if they are on promotion. Those aged 25-34 (86%) and 45-54 (85%) would like to see more promotions on fruit and vegetables, compared to under 25s (69%).
- Those under the age of 55 were more likely than over 55s to say they would like to see healthier products in takeaways (39% vs 24%), fast food restaurants (36% vs 23%), food outlets in leisure facilities (30% vs 15%), and in vending machines (17% vs 8%).
Socio-economic group
- Participants from higher socio-economic groups were more likely to agree that their personal (69%) and their children’s (74%) eating habits were healthy compared to those from lower socio-economic groups (45% and 55%, respectively).
- Participants from higher socio-economic groups were more likely to opt for healthier options when food shopping (70%) and eating out (31%), compared to those from lower socio-economic groups (56% and 20%, respectively). They would also like to see more healthier options on the menu when eating out (45% vs 28%).
- Participants from lower socio-economic groups (48%) were less likely to find out how much calories, saturated fat, sugar or salt are in a product when food shopping in store than those from higher socio-economic groups (33%).
- Awareness of traffic light labelling, usage of the system, as well as understanding of its purpose is higher among those from higher socio-economic groups compared to those from lower socio-economic groups (96% vs 90%, 52% vs 34%, and 89% vs 71%, respectively).
- Those from higher socio-economic groups found it easier than those from lower socio-economic groups to choose healthier food and meals in store at supermarkets (80% vs 62%) in restaurants and/or pubs (53% vs 35%) and in fast-food restaurants (19% vs 8%).
Conclusions
- Additional consumer education is required to increase awareness of daily calorie intake, especially among men, as a low proportion understand the guidance on this. Awareness campaigns might be particularly effective if they target consumers at the point of purchase e.g. in-store at supermarkets, where the majority of consumers are doing their shopping.
- Food businesses can help consumer decision making by enhancing the visibility and clarity of nutritional claims on product packaging. Since a considerable proportion of consumers use nutritional claims when purchasing food, it is crucial that these claims are easy to understand and noticeable if they are to be effective.
- Efforts could be made to educate consumers on how to use traffic light labels to be able to identify healthier options. Despite a very high level of recognition, less than half of consumers actively use traffic light labels. Education efforts should have a specific focus on men, individuals from lower socio-economic groups, and those aged 55 and over, given lower reported usage among these audiences.
- Enhancing and increasing offers on fruit and vegetables could be considered in the future, given that the majority of consumers indicate a preference for such promotions, which in turn implies a strong market demand. However, it would be essential to ensure that these promotions appeal to consumers, in order to increase the current low frequency of purchase.
- Targeting healthier eating campaigns towards those in lower socio-economic groups could be a beneficial strategy as the data suggests less healthy eating habits and difficulties in choosing healthier options among those in lower socio-economic groups.
Appendices
Appendix 1 - Survey questionnaire
In the last 12 months, who is typically responsible for the food shopping for your household? Please include both online and in store food shopping.
- I am responsible for all or most of the food shopping
- I share the responsibility with someone else
- Someone else in my household
- Someone else outside of my household e.g., a relative or carer
- Each person is responsible for their own food shopping
- Don’t know
Which of the following best describes your gender?
- Man
- Woman
- Non-binary
- My gender is not listed
- Refused/prefer not to say
What is your age?
Can you confirm your postcode?
Which of these regions best describes where you live?
- Belfast City
- Greater Belfast
- Co. Down
- Co. Armagh
- Co. Tyrone/ Co. Fermanagh
- Co. Derry
- Co. Antrim
- None of these
Which of these best describes the area you live in?
- Open countryside
- A hamlet
- A village
- A small town in the countryside
- A medium town
- A large town
- Inner city
- Outer city (Suburban)
Please indicate to which occupational group the Chief Income Earner in your household belongs, or which group fits best.
The Chief Income Earner is the person in your household with the largest income, including you. If the Chief Income Earner is retired but still has the largest income via an occupational pension, please answer for their most recent occupation.
If the Chief Income Earner is not in paid employment but has been out of work for less than 6 months, please answer for their most recent occupation.
- Self Employed / Business Owner
- Skilled manual worker (e.g. Skilled Bricklayer, Carpenter, Plumber, Painter, Bus/ Ambulance Driver, HGV driver, AA patrolman, pub/bar worker, etc.)
- Semi or unskilled manual work (e.g. Manual workers, all apprentices to be skilled trades, Caretaker, Park keeper, non-HGV driver, shop assistant)
- Supervisory or clerical/junior managerial/professional/ administrative (e.g. Office worker, Student Doctor, Police Constable, Firefighter, Foreman with 25+ employees, salesperson, etc.)
- Intermediate managerial/professional/administrative (e.g. Newly qualified (under 3 years) doctor, Solicitor, Board director small organisation, middle manager in large organisation, teacher, principal officer in civil service / local government, military lieutenant)
- Higher managerial/professional/administrative (e.g. Established doctor, Solicitor, Architect, Board Director in a large organisation (200+ employees), head teacher, police/fire chief, top level civil servant / public service employee, high ranking military officer)
- Casual worker – not in permanent employment
- Student
- Housewife / Homemaker
- Retired and living on state pension
- Unemployed or not working due to long-term sickness
- Full-time carer of other household member
Do you have any children aged under 16 living at home currently?
- Yes
- No
And how old are your children?
- 0-3
- 4-6
- 7-10
- 11-13
- 14-16
We would like you to take a moment to think about healthy eating.
What does healthy eating mean to you?
Here is a picture of the Eatwell Guide which shows how much of what we eat overall should come from each food group to achieve a healthy, balanced diet.
On a scale of 1-5 where 1 is strongly disagree and 5 is strongly agree…
Based on the image of the Eatwell Guide, which represents a healthy, balanced diet, to what extent would you agree or disagree that your personal eating habits are healthy?
Based on the image of the Eatwell Guide, which represents a healthy, balanced diet, to what extent would you agree or disagree that your your children’s eating habits are healthy?
- Strongly disagree
- Tend to disagree
- Neither agree nor disagree
- Tend to agree
- Strongly agree
- Don’t know
To what extent do you agree or disagree with the following statements:
- When shopping for food, I try to choose healthier versions of products e.g. low in fat, high in fibre.
- When eating out, I try to choose a healthier option from the menu e.g. lower calorie option, dish with a higher vegetable content etc.
- When eating out, I would like to see more healthier options on the menu e.g. lower calorie options, dishes with a higher vegetable content etc.
- Strongly disagree
- Tend to disagree
- Neither agree nor disagree
- Tend to agree
- Strongly agree
- Don’t know
What do you think the Government recommended daily calorie intake is for men?
What do you think the Government recommended daily calorie intake is for women?
In a typical month, where do you shop for food?
- Supermarket (including mini supermarkets for example, Metro/local)
- Online delivery from a supermarket (including home delivery and click and collect)
- Home delivery not from a supermarket (for example, vegetable boxes, Deliveroo, Hello Fresh)
- Local/corner shop, newsagents, or garage forecourt
- Independent greengrocer, butcher, baker, or fishmonger
- Market/farmers’ market/farm shop
- Other (please specify)
- None of these
How, if at all, do you tend to find out how much calories, saturated fat, sugar or salt are in a product when food shopping in store?
- Look at nutrition claims e.g. low fat, low sugar, high fibre
- Look at the nutritional labelling on the front of the packet e.g. traffic light labelling
- Use the nutritional labelling on the back of the packet
- Other (please specify)
- I don’t try to find this out
How, if at all, do you tend to find out how much calories, saturated fat, sugar or salt are in a product when food shopping online?
- Look at nutrition claims e.g. low fat, low sugar, high fibre
- Look at the nutritional labelling on the front of the packet e.g. traffic light labelling
- Use the nutritional labelling on the back of the packet
- Other (please specify)
- I don’t try to find this out
Thinking about when you are choosing food whilst shopping, some foods show traffic light labels on the front of packets/packaging.
Here is an example image of the traffic light label.
Do you recognise this traffic light image?
- Yes
- No
Do you use this when shopping for food?
- Yes
- No
On a scale of 1-5 where 1 is strongly disagree and 5 is strongly agree, to what extent would you agree or disagree with the following statement:
I understand what traffic light labels on the front of food packaging are for.
- Strongly disagree
- Tend to disagree
- Neither agree nor disagree
- Tend to agree
- Strongly agree
- Don’t know
What do you think these traffic lights are for?
How often, if at all, do you choose:
- Foods with ‘healthier’ traffic light colours (green/amber)?
- Foods with a lower percentage of my recommended daily calorie intake?
- Never
- Rarely
- Every now and then
- Most times
- Always
- Don’t know
Which, if any, of these do you do when buying food for yourself?
Which, if any, of these do you do when buying food for your children?
- I look at the calories next to the traffic light label
- I use the traffic light label to understand the amount of Fat in products
- I use the traffic light label to understand the amount of Saturated fat in products
- I use the traffic light label to understand the amount of Sugar in products
- I use the traffic light label to understand the amount of Salt in products
- I use the traffic light label to find information on portion size
- I don’t do any of these
We would now like you to think about promotions on food, such as money off or reduced price offers or offers like buy one get one free.
To what extent would you agree or disagree with the following statements on promotions:
- I am more likely to purchase fruit and vegetables if they are on promotion.
- I am more likely to purchase chocolate confectionery, crisps, snacks etc. if they are on promotion.
- I would like to see more promotions on fruit and vegetables.
- Strongly disagree
- Tend to disagree
- Neither agree nor disagree
- Tend to agree
- Strongly agree
- Don’t know
Overall, for each of the following, how easy or difficult is it for you to choose healthier food and meals?
- When buying from a supermarket in-store
- When buying from a supermarket online
- When buying from a local/corner shop, newsagent, or garage forecourt
- When eating in restaurants and/or pubs
- When eating in my staff restaurant at work
- When preparing meals at home
- When buying food from a vending machine
- When buying from cafés/sandwich shop e.g. supermarket cafés/high street coffee shops
- When buying from a take-away
- When buying from/eating in a fast-food restaurant
- In food outlets in leisure facilities e.g. cinemas, bowling alleys, entertainment centres
- Very difficult
- Quite difficult
- Quite easy
- Very easy
- Not applicable
Where, if in any setting, would you like to see healthier products?
- Supermarkets
- Local/corner shop, newsagents, or garage forecourts
- Restaurants and/or pubs
- Staff restaurant at work
- Vending machines
- Cafés/Sandwich shops e.g. supermarket cafés/high street coffee shops
- Fast food restaurants
- Takeaways
- Food outlets in leisure facilities e.g. cinemas, bowling alleys, entertainment centres
- Other (please specify)
- None of these
Have you ever noticed calories being shown on a food menu in any of these places?
- Restaurants/pubs
- Staff restaurant at work
- Cafés/Sandwich shops e.g. supermarket cafés/high street coffee shops
- Fast food restaurants
- Takeaways
- Food outlets in leisure facilities e.g. cinemas, bowling alleys, entertainment centres
- Other (please specify)
- None of these
How often, if at all, do calories shown on a food menu influence your decision of what to eat?
- In restaurants/pubs
- Staff restaurant at work
- In cafés/Sandwich shops e.g. supermarket cafés/high street coffee shops
- In fast food restaurant
- In takeaways
- Food outlets in leisure facilities e.g. cinemas, bowling alleys, entertainment centres
- It never influences my decision
- Not very often
- Every now & then
- Most times
- It always influences my decision
In what venues, if any, would you like to see calories being shown on a food menu?
- Restaurants/pubs
- Staff restaurant at work
- Cafés/Sandwich shops e.g. supermarket cafés/high street coffee shops
- Fast food restaurants
- Takeaways
- Food outlets in leisure facilities e.g. cinemas, bowling alleys, entertainment centres
- Other (please specify)
- None of these
- Don’t know
Thinking about when you are shopping for/choosing food products, in particular manufactured products such as sauces, cereals, meals, snacks, and puddings.
How likely or unlikely are you to buy these options compared to a regular version of products? (e.g. for sauces, cereals, meals, snacks & puddings)?
- Reduced sugar products
- Reduced saturated fat products
- Reduced salt products
- Smaller portion sizes of sugary snacks/meals
- Smaller portion sizes of snacks/meals high in saturated fat
- Smaller portion sizes of snacks/meals high in salt
- Much less likely to buy it
- A little less likely to buy it
- It wouldn’t change
- A little more likely to buy it
- Much more likely to buy it
Which, if any, would you like to see more of when you buy food?
- Reduced sugar products
- Reduced saturated fat products
- Reduced salt products
- Products with a maximum limit on calories (e.g., chocolate bars, sweets, slices of cake, croissants, biscuits)
- Smaller portion sizes of sugary snacks/meals
- Smaller portion sizes of snacks / meals high in saturated fat
- Smaller portion sizes of snacks / meals high in salt
- None of these
Please select the range which best describes your annual household income?
If you’re not sure, your best guess is fine.
- Under £10,000
- £10,000-£19,999
- £20,000-£29,999
- £30,000-£39,999
- £40,000-£49,999
- £50,000-£59,999
- £60,000-£69,999
- £70,000-£79,999
- £80,000-£89,999
- £90,000-£99,999
- £100,000+
- Not sure / Don’t know
- Would rather not say
Appendix 2 - Sample demographics
Table 1: Age bands, proportion in NI population and proportion in survey
| Age band | Proportion in the population | Weighted proportion | Proportion in the survey |
|---|---|---|---|
| 18-24 | 11% | 11% | 10% |
| 25-34 | 17% | 17% | 21% |
| 35-44 | 17% | 17% | 18% |
| 45-54 | 17% | 17% | 16% |
| 55-64 | 17% | 17% | 13% |
| 65 or older | 22% | 22% | 21% |
Base: 601 adults in Northern Ireland
Table 2: Gender, proportion in NI population and proportion in survey
| Gender | Proportion in the population | Weighted proportion | Proportion in the survey |
|---|---|---|---|
| Male | 49% | 49% | 49% |
| Female | 51% | 51% | 51% |
Base: 601 adults in Northern Ireland
Table 3: Socio-economic group, proportion in NI population and proportion in survey
| Socio-economic group | Proportion in the population | Weighted proportion | Proportion in the survey |
|---|---|---|---|
| ABC1 | 45% | 45% | 40% |
| C2DE | 55% | 55% | 60% |
Base: 601 adults in Northern Ireland
Appendix 3 - Socio-economic groupings
Table 4: Explanation of socio-economic groupings
| Grade | General description | Examples of occupations | Retiree description |
|---|---|---|---|
| A | These are professional people, or are very senior in business or commerce or are top level civil servants. |
|
Retired people, previously grade A, and their widows. |
| B | Middle management executives in large organisations, with appropriate qualifications Top management or owners of small business. |
|
Retired people, previously grade B, and their widows. |
| C1 | Junior management owners of small establishments: and all others in non-manual positions Jobs in this group have very varied responsibilities and educational needs. |
|
Retired people, previously grade C1, and their widows. |
| C2 | All skilled manual workers, and those manual workers with responsibility for other people. |
|
Retired people, previously grade C2, with a pension from their job. |
| D | All semi-skilled and unskilled manual workers, and apprentices and trainees to skilled workers. |
|
Retired people, previously grade D, with a pension from their job. |
| E | All those entirely dependent on the state long term, through sickness, unemployment, old age, or other reasons. Those unemployed for a period exceeding 6 months (otherwise classify on previous occupation). Casual workers and those without a regular income. Only households without a chief wage earner will be coded in this group. |
|
N/A |