Evaluation of the Food Standards Pilot in Wales
Evaluation of the Food Standards Pilot in Wales: Findings
Penodol i Gymru
This section summarises the findings of the evaluation of the food standards pilot in Wales.
2.1 Baseline
A baseline round of LA interviews was conducted before the pilot. The purpose of baseline interviews was to compare the changes between the baseline and the end of the pilot, as well as to observe whether the control LAs evolved in a different manner to the pilot LAs. The interviews explored how LAs were currently implementing the existing model, challenges faced and expectations around the pilot.
2.1.1 Approach to current delivery of official controls in Wales
There are two different approaches within LAs to the delivery of official food controls in Wales: those LAs that deliver all food standards official controls through a dedicated food standards team, and those LAs that operate a joint service delivering food hygiene and food standards official controls via a single team.
- No joint service delivery (food standards): These LAs deliver food standards controls separately to hygiene controls. They explained they assess and identify their food standards interventions following the Code but will often emphasise high-risk premises. Their teams would assess business risk and allocate the interventions at the beginning of the year. Their sampling and project priorities determined on a local or regional basis can also guide the remainder of the work they do.
- Joint service delivery (food standards and food hygiene): These LAs use the same team to carry out food standard and food hygiene inspections. When they can, they aim to do joint inspections. For example, for medium and low risk premises, LAs would decide whether a food standard inspection is needed or not while reviewing the food hygiene inspection programme. As food hygiene controls are often delivered more frequently (every 6 months) than food standards (high risk being every 12 months), food hygiene inspections often dictate the timings and selection of establishments for food standard inspections. Sometimes, for specific high-risk food standard premises, LAs would prioritise food standards and visit them. The LAs interviewed perceived that, since they started delivering food standards and food hygiene inspections jointly, they are more efficient in their way of working. They mentioned they are able to carry out more interventions than before. However, they also explained that not all officers perceive themselves to be capable to carry out food standards. They said officers from the food hygiene team had a steep learning curve to get the level of technical knowledge necessary to deal with some of the complexities of food standards.
During the interviews, the LAs discussed specific practices around key areas:
Identification and resolution of non-compliances
LAs commonly identify non-compliances through inspections, complaints, or sampling activities. High-risk premises are prioritised, with notification to businesses upon finding non-compliance. LAs would recommend remedial actions to follow up on how the business has addressed the non-compliance. These vary based on severity of non-compliance, from simple fixes with photographic evidence to re-visits or prosecution. However, resource constraints and backlogs due to the COVID-19 pandemic have strained inspection capacities.
Use of Intelligence
LAs use intelligence, gathered from various sources, to help identify any potential non-compliance and risk areas. Two of the LAs included in the pilot explained they were already effectively incorporating intelligence into their work. One of these two LAs is the regional intelligence lead for Wales. However, the other two LAs mentioned using intelligence was challenging for them as it was time-consuming to record and share intelligence in line with relevant requirements. They also perceived the information they held or received was not always complete. Overall, the four LAs that participated in the pilot project perceived intelligence-led approaches were beneficial for resource allocation and risk targeting and would like to use more of these approaches in the future.
Sampling activities
LAs explained that food sampling priorities are set on a national, regional, and local basis. This happens annually. At national level, the yearly sampling priorities are selected following criteria that the FSA in Wales determines. Some LAs supplement this information with relevant data from the National Food Crime Unit (NFCU). On a regional basis, LAs emphasised there were some regional differences between North and South Wales when determining sampling priorities. As such, LAs in Wales also coordinate with their regional areas to set priorities. Recently, local budget reductions meant LAs rely more on knowledge sharing and suggestions on what to focus on, working as a region.
Adaptations to the current model
LAs explained they are making small adaptations to the existing model for better efficiency and flexibility. Some examples of these adaptations included seeking flexibility in business rankings (in terms of high, medium or low risk), identifying improvements to make the process reviews more efficient, and incorporating lessons learned from the pandemic into their practices. However, the four LAs explained they would appreciate the Code having more flexibility to account for regulatory changes and the evolving food sector.
In summary, the four LAs perceived that while the existing food standards delivery model in Wales had demonstrated effectiveness, the current delivery model had some challenges related to its rigidity (e.g. reduced flexibility could lead to LAs to miss allergen issues due to changes in menus or suppliers), not being up to date with regulatory changes (e.g. new types of establishments or ingredients) and the allocation of resources. LAs emphasised they would prefer the delivery model to focus on outcomes rather than mere inspection completion numbers. As such, LAs were excited to test the proposed model hoping it would address some of the challenges identified.
2.2 Research Question 1: How did the proposed model perform compared to the current framework? What worked well and less well?
The proposed model operated well, was fit for purpose and was generally easy to understand and use.
Both pilot LAs perceived that the proposed model addressed the limitations identified of the prior model. The proposed model provided a more balanced assessment of the food businesses taking account of both the level of inherent risk and the level of compliance displayed. The proposed model ensured the next official control after significant non-compliance identification are a priority, allowing LAs to target their resources towards those visits. This is more in line with how the LA feels interventions and the food standards service should be operating and was motivational for the team.
The proposed risk scheme was seen as beneficial and the addition of the standalone allergen score was particularly valuable in assisting LAs to give allergens proportional focus within interventions and target resource where the risks are highest.
The proposed decision matrix which indicates the intervention frequency for businesses was also seen as beneficial.
Despite the positive reflections, LAs found some of the terminology lacked clarity which made it challenging to implement the proposed risk scheme in a consistent manner. Key areas where more clarity was expected were:
- Guidance on the allergen scoring criteria and the thresholds between scores.
- Expanding on the risks of online distribution within the code and guidance.
- Definitions and interpretation of key terminology and phrasing.
This section presents the findings showing how well the proposed model worked. It assesses whether the model was fit for purpose, its ease of use and any challenges identified in using the proposed model in relation to its application and operation. This section also analyses the context in which the pilot was delivered, assessing the enabling factors and barriers faced during the implementation of the pilot project itself. The effects of the proposed model, namely whether it achieved its objectives, are discussed in section 2.5
2.2.1 Appropriateness of the proposed model (fit for purpose)
Both pilot LAs perceived that the proposed model was fit for purpose, and was an improvement in comparison to the current model as it addressed the limitations identified of the current model. LAs perceived that the proposed model provided a more balanced assessment of the food businesses taking account of both the level of inherent risk and the level of compliance displayed. However, both LAs noted that the accompanying guidance to implement the proposed model could be improved (see section 2.2.3).
The rest of the section explores the appropriateness of the three elements of the proposed model (the risk scheme, the decision matrix, and the inherent risk desktop assessment). Two of the elements were considered positive, however there were concerns about the inherent risk desktop assessment for new businesses.
2.2.1.1 The proposed risk scheme
Pilot LAs welcomed the proposed risk scheme. LAs reported that the proposed model allowed for more flexibility than the existing one, enabling them to effectively target resources to higher risk establishments. This is because the proposed model combines the assessment of inherent risk of the establishment with a more comprehensive assessment of the establishment’s compliance (through assessment of four factors instead of the current two). The way the two risk elements are combined is also improved as the proposed model uses a matrix approach to average the scores. It also includes an assurance rule whereby any compliance factor given a score of 1, the lowest level of compliance, results in an overall compliance score of 1 as the averaging process is ignored. This assurance rule better accommodates the high risk posed by non-compliance in the overall scores in comparison to the current model where scores are added together. The proposed risk scheme gives a more balanced assessment, allowing the level of compliance within a business to be a more prominent part of the rating rather than focusing primarily on inherent risk. It allows for more granularity in the risk assessment process.
While under the current model, LAs consider the risks of allergens and act on all non-compliances found relating to allergens, all four LAs (pilot and control) perceived that, as mentioned in the baseline (section 2.1.1), the current risk scheme did not sufficiently reflect the high risk posed by allergens.
As such, pilot LAs found the way the proposed allergen risk score was incorporated into the risk scheme particularly beneficial. One pilot LA felt that the standalone allergen score helped to emphasise the importance of the food standards service within overall food safety.
2.2.1.2 The decision matrix
Overall, it was reported by both pilot LAs that the proposed decision matrix worked well and there were some benefits to the increased number of risk categories and intervention frequencies such as the more accurate prioritisation of risks and ability to reduce resourcing focus on food businesses who are considered low risk and highly compliant.
The decision matrix was reported to be easy to use. However, there was an adjustment period needed before food standards officers felt comfortable and confident with the new risk levels within the proposed decision matrix. One LA commented that, initially, the proposed decision matrix was challenging for them. This is because the proposed decision matrix contains 10 risk frequencies compared to the current three. They had to switch their way of thinking from the prior ‘A’ high risk, ‘B’ medium risk and ‘C’ low risk to a different fit within the risk categories. A period of transition is expected given the length of time the current model has been in use (see section 2.3.3 for the FSA response and preparation on this).
Pilot LAs were also concerned about the change in the frequency of visits for some establishments. One LA was particularly concerned about large manufacturers. While large manufacturers are largely compliant, the LA was keen to maintain contact and rapport with the FBOs teams – as one non-compliance (even if unlikely) could have large consequences. Under the current model all manufacturers are classed as high-risk meaning that they should receive an annual inspection from the LA. The proposed model, however, showed that the intervention frequency for large manufacturers only decreased for two manufacturers and increased for four, out of a total of nine manufacturers, as shown in section 2.5.1.5. It should also be noted that the frequencies generated by the risk matrix represent a minimum frequency of intervention and LAs have the flexibility under the Code to bring interventions forwards if deemed appropriate.
2.2.1.3 New businesses: inherent risk desktop assessment
The proposed model also introduces a desktop assessment (DA) to assign new establishments with an estimated inherent risk and assist in prioritising initial inspections of new businesses. The DA uses multiple data sources, including Register A Food Business (RAFB), other documentation that may be used when registering a food business as well as publicly available data sources such as a business’s website. The proposed DA aims to enable more effective prioritisation of new business initial inspections and provide a structure to support LAs with an increasing backlog of unrated new businesses. The mandating of desktop assessments will be considered as part of any potential consultation prior to consideration of providing advice to Ministers regarding a potential wider roll out of the proposed model in Wales. Both pilot LAs were asked to use it during the pilot period. Further details on this mechanism are available in Annex 1. The aim is to prioritise food businesses for initial intervention based on their perceived inherent risk.
Of the two pilot LAs, one found this new process burdensome as they perceived that it added paperwork without providing additional insights. They mentioned they were already following a similar process internally; however, they explained that the DA took longer for them to complete without adding additional value. They recommended including additional questions in the business registration form to streamline the inherent risk assessment process.
The other LA did not comment on this.
2.2.2 Ease of use of the proposed model
Both pilot LAs found the proposed model easy to use once they had built up their confidence and understanding. They emphasised that the change is only about frequency of interventions and how they assess risks and compliance, but the interventions remain the same.
One pilot LA appreciated the increased capacity to prioritise revisits to non-compliant food businesses through the new proposed 1-, 3- and 6-month intervention frequencies. This was identified as a positive feature, as under the current model revisits are scheduled but often given lower priority compared to priority interventions already scheduled. Due to resource constraints, these revisits are often delayed. The proposed model ensures revisits after a non-compliance are identified as a priority, allowing LAs to target their resources towards those visits. This element allows LAs to focus on addressing non-compliances quickly rather than focusing on the number of interventions that have taken place. This is more in line with how the LA feels interventions and the food standards service should be operating and was motivational for the team.
The proposed model was viewed as being compatible with the way that LAs perceived food standards should operate, as it identified the major risks and enabled the LAs to prioritise revisits to seek to resolve non-compliances.
2.2.3 What were the enablers (what worked well) and the barriers (what worked less well) for implementation of the proposed model?
The FSA support was a key enabling element in the success of the pilot. The support received from the FSA before and during the pilot was reportedly very useful to LAs. The pilot opened a line of informal communication between the FSA and the LAs, where they could collaborate to solve issues together.
The FSA were identified as being responsive to communication. LAs felt they had a ‘point of contact’ where their queries would be addressed. More detail on training and support provided can be found in section 2.3.1.2. One LA reported conducting their own in-house consistency exercises to help provide further reassurance.
Despite the benefits identified and the positive feedback around the proposed model and the FSA’s support both pilot LAs identified one main barrier to consistent implementation and areas for improvement – around terminology used. There were a number of areas within the risk scoring guidance which were open to interpretation and further definitions and guidance are needed, namely:
- Scoring of premises which pose ‘no allergen risk’ in the view of LAs (e.g. only selling pre-packed food or producing single-ingredient foodstuff like honey). Clarity was needed on how to give an allergen score for premises who have ‘no allergen risk’ and therefore no allergen information or process.
- Clarity around thresholds between the scores for the allergen information risk score (for example between a score of 1 and a score of 2). It was unclear for the LAs what the tipping point was between these two scores. The LAs felt that any level of non-compliance on allergens poses a high-level of risk to consumers. This clarity is needed to avoid food businesses being scored more harshly than necessary, impacting their intervention frequency.
- One LA identified that online distribution is not sufficiently discussed within the current guidance. This was particularly the case for the wording ‘scale of supply and distribution’ and whether online distribution should be considered within this. The LA highlighted that although often online distribution is at a local level the online format means that distribution could be national or international. The LA had noted a substantial difference in how their officers were scoring the inherent risk of FBOs who distribute online.
- Definitions and increased clarity around the wording ‘wide range’ and ‘limited range’ within the phrase ‘Establishments responsible for producing or labelling a wide range [or limited range] of foods’ within the Ease of Compliance criteria. The LA gave the example of a manufacturer who produces 25 different ready meals, are they considered to be producing a wide range or would they need to produce a range of different products in addition to ready meals to be wide range.
- Better links to existing definitions and increased clarity around key words such as ‘local’ to ensure consistency in approach and confidence in the continuity of definitions between the current model and the proposed model.
Both pilot LAs reported that the proposed model was fit for purpose but that increased clarity and guidance covering the above identified issues would increase their confidence in using the proposed model and the consistency of risk assessment and management across Wales. This was under the context of limited resource capacity meaning that if food businesses were not identified as needing priority intervention they could end up having limited contact with the LA.
2.3 Research Question 2: What has been the experience of each of the stakeholders with respect to specific elements of the proposed model, and the proposed model changes as a whole?
The experience of each stakeholder (LAs and FSA) was overall very positive.
- LAs decided to join the pilot because they wanted to understand and influence the proposed model with FSA, and to be able to adapt early to it. Their experience during the pilot met these expectations.
- LAs reported that they received all of the training and support prior to and during the pilot period that they would have liked. They found the food business “risk assessment” scoring scenario exercise and discussion to be particularly beneficial for increasing understanding and highlighting areas of interpretation.
- There were few challenges reported regarding implementation of the proposed model.
- One LA highlighted concerns around the database mapping conducted to convert the risk score of the premises on their databases to the new risk assessment scheme of the proposed model.
- The proposed model had no impact on use or sharing of intelligence, sampling activities or use of remote inspections (these were aspects of the initial pilot but were not the main focus under the Wales pilot).
- LAs reported no unintended consequences from the pilot or the proposed model.
- The FSA reported that the proposed food standards model had run as expected and overall, the pilot had been a positive experience. They noted the request for further guidance and clarification on certain areas.
This section analyses the experience of the different stakeholders engaged in the pilot and their perspective on the new proposed model. The section addresses the reasons for LAs to join the project, considers LAs’ attitudes towards the pilot and finally summarises the FSA experience of the pilot.
2.3.1 LA experience
2.3.1.1 LA motivations for joining the pilot
LAs decided to join the pilot project for a number of reasons. All LAs stated that the decisive factors for joining were their willingness to influence the model to ensure it fits their needs, and the capacity to anticipate and adapt to the changes as soon as possible. LAs appreciated having the opportunity to start early and work on this new proposed model with the FSA. This shows that all LAs participating in the pilot, whether testing the proposed model or in the control group, had already identified some challenges with the prior model, were willing to try the proposed one, and to collaborate with the FSA to ensure a smooth transition. They all voluntarily expressed an interest in participation after an invitation from the FSA was sent out to all LAs in Wales.
2.3.1.2 Preparation for implementing the proposed model
The FSA supported LAs prior to and during the implementation of the pilot. Section 2.2.3 discussed that LAs found this support to be one of the enablers of the pilot process. Preparation activities carried out included:
- An in-person contact day in Cardiff with the FSA to gain understanding of the proposed model, including a pilot LA from the initial pilot explaining their experience and an exercise where everyone individually rated a food business scenario and then discussed the differences in their scoring. This highlighted some of the interpretation issues (discussed in section 2.2.3).
- FSA visit day at the LA premises where the FSA spoke with all staff involved in the pilot and answered any queries. The LA team leads really appreciated this approach as it meant questions could be asked directly and avoided all of the information being passed to the lead officer and then cascaded down to the rest of the team.
- Regular contact with the FSA team to respond to queries.
Both LAs reported receiving all of the training and support that they would have liked. They found the scenario exercise from the contact day particularly useful. As a result, one of the pilot LAs decided to implement a consistency training with their food standards team, which included a scoring of a scenario exercise (this is discussed further in section 2.3.1.3 below). The FSA team member running the training felt that it went well, there was good engagement from the LAs in the activities and many clarification questions were asked at this stage. They also felt that the scenario exercise was particularly useful.
Support from the FSA continued throughout the pilot in the form of monthly joint catch-up meetings with the two pilot LAs and some individual meetings. These meetings facilitated sharing of experiences and learning from all parties, noted as a benefit by the two pilot LAs. The pilot LAs reported that having one point of contact within the FSA had been beneficial and useful as it ensured clearer messaging and allowed for more open sharing of issues.
Online meetings were held with the control LAs prior to the start of the pilot to establish and discuss the data submission aspects that the control LAs would be required to complete. The control LAs were also offered regular meetings but did not take up this offer as they did not require any additional support from the FSA as they were operating as normal under the current model.
2.3.1.3 Implementing and working with the proposed model
Both pilot LAs trained some, or all, of their officers to work with the proposed model. One pilot LA provided additional support to their team for the implementation of the pilot:
- Setting up of a Microsoft Teams site to share guidance and provide space for their team to ask questions.
- Fortnightly catch ups with the LA team to discuss how the pilot model was working.
- Running of ‘consistency exercise sessions’ where the LA team could discuss any interpretation issues or queries to ensure a level of consistency across the team for scoring of premises. These sessions reduced in frequency through the pilot period showing an increase in confidence in implementation of the proposed model. The LA found these exercises to be very useful and are considering running a session annually regardless of the outcome of the pilot.
2.3.1.4 Challenges to implementing the proposed model
Overall, both pilot LAs reported not having any major challenges with implementing the proposed model. They both noted that the team required training and an adjustment period, which they expected. Once the confidence and understanding was built there were no major questions.
One LA identified issues with the initial mapping of their database (Initial exercise conducted by the FSA to define the new intervention frequencies for each establishment at the start of the pilot.) and resulting initial risk scores. This LA team were very familiar with their ‘A’ rated premises so expressed concern when not all these were flagged as priority interventions after the mapping to the proposed model was completed. The LA gave one example where a manufacturing site had not been rated a priority due to its high level of compliance, but they considered it to be higher risk as it produces allergen sensitive products and distributes them widely. The mapping system used for the pilot primarily used the overall business type e.g. ‘manufacturer’ to map food businesses to the new proposed risk matrix and therefore did not consider any contextual information. However, this is only a risk during the initial set up stages of the proposed model as the systems are converted. Once outliers have been identified and interventions resume this risk decreases. The FSA response to this ahead of the England and Northern Ireland roll out of the proposed model can be found in section 3.2.1. This shows a risk of the current database mapping system which only considers the food business type.
The LA noted that for their LA, due to having a smaller and more experienced team, knowing which premises should be a priority was easy but that for other LAs, with many more premises to cover, the initial mapping may lead to rating some premises wrongly. The FSA has noted this risk and is reflecting on how to mitigate it (see section 3.2.1).
2.3.2 Other aspects of food standards operations
The Welsh pilot of the proposed food standards delivery model did not include a directed focus on piloting use of intelligence, directed sampling or targeted remote interventions (elements tested in the initial pilot, see section 1.1.1 and Table 1.1). There was potential for directed sampling and intelligence tasking to be issued but these did not materialise throughout the pilot. The LAs were able to use remote interventions as and when they considered they were appropriate.
These elements were discussed with LAs to understand if the proposed model had had any unintentional impact in these areas. It was found that the pilot did not impact on levels of sampling, remote interventions or use of intelligence for all four of the LAs.
2.3.2.1 Intelligence
There is a very wide range of understanding and use of intelligence across the four LAs. Interview data showed that intelligence is typically gathered through reports on the intelligence database system (IDB), reports from the FSA NFCU, complaints from other sources, sampling data, discussions within the regional sampling groups, discussions at the food standards expert panel, and the export/import control groups.
Baseline data showed that the two pilot LAs used and shared less intelligence than the two control LAs before the pilot started. Data from the pilot period shows that the control LAs submitted a total of 14 intelligence reports to IDB and the pilot LAs submitted a total of 4 reports. However, to put this in context one control LA is the regional intelligence coordinator for Wales meaning that they already submit above average volumes of intelligence as part of their day-to-day intelligence role. The other control LA specified in their baseline interview that this year they were focusing on improving their use and sharing of intelligence. On the other hand, the two pilot LAs noted that they struggle to upload intelligence onto IDB due to resource constraints and lack of confidence with the IDB system. It is therefore likely that the difference in intelligence reporting during the pilot period between the pilot and control LA was as a result of the specific LAs pre-existing relationship with intelligence rather than being caused by the proposed model.
LAs noted in interviews that they do act on intelligence reports where they are relevant.
One LA stated that more clarity is needed in some intelligence reports sent and received by LAs to make sure they include all necessary details to ensure that LAs can use intelligence to guide their work and support them in identifying the likelihood of the risk or threat identified. All four LAs indicated that they would like to use intelligence more in the future.
2.3.2.2 Sampling
Qualitative data from interviews shows that the four LAs are involved in regional sampling groups and follow the regional sampling plans. LAs confirmed in interviews that this set up had not changed during the pilot period and many of the sampling plans were set prior to and covered the whole pilot period.
The proposed model did not have an impact on sampling for the four LAs.
2.3.2.3 Remote interventions
All four of the LAs showed hesitancy around the use of remote interventions (RI). No RI’s were conducted as part of the pilot but there were some examples of where LAs were beginning to use RI style interventions. One control LA gave the following example: directing a non-qualified officer to check that a simple non-compliance had been rectified (dependent on type of non-compliance) or do a selected ‘C’ rated food business intervention (e.g. clothing retailers with pre-packed sweets at the counter) using a self-assessment questionnaire, this example is under the current model and was not used during the pilot period.
Joint service LAs noted that when joint interventions were needed, they would always have to be done in-person to satisfy the Food Hygiene Rating Scheme (Food Hygiene Rating (Wales) Act 2013). Single service LAs were also hesitant as they felt that in-person interventions were a better way to guarantee an accurate scoring and that FBOs may not mention something that they do not see as relevant but that the trading standards officer could find if they were in-person at the premises. The responsibility for protecting the public from risk impacts upon trading standards officer’s confidence in implementing RIs rather than in-person interventions. Confidence is the main barrier to use of RIs.
When asked in interviews where LAs felt RIs could be appropriate or where they may wish to use them in the future each LA did identify examples of where they could be used. Examples given included checking on updated risk assessments or an allergen matrix via email. The two pilot LAs identified that RIs could be used with the short frequency interventions but they stressed that this would depend on the nature of the non-compliance identified.
2.3.3 The FSA experience (Food Standards Agency reflections and response)
2.3.3.1 Food Standards Agency reflections on the pilot
The FSA reflections on the implementation of the pilot were positive. The staff involved in the implementation and working regularly with the LAs shared that the regular communication with LAs had been the key to the success of the project.
The FSA perceived that a challenge could be LAs reactions to changes in frequency of interventions, especially a potential increase in the number of interventions (this perception was based on engagement with LAs across Wales prior to the pilot). However, after risk scores were mapped to the proposed model the new risk frequencies showed that this was not the case (See section 2.5.1.5).
Another challenge identified by the FSA was the administrative burden for LAs caused by the extra data submission spreadsheets for the pilot monitoring (this included additional data submissions and the use of a scheduling spreadsheet which acted as a temporary management information system (MIS) to guide the work during the pilot, this will not be part of a wider roll out). The FSA noted that both pilot and control LAs in the Wales pilot were funded to submit this data and the extra data submissions would not be part of any potential roll out in Wales. Additionally, the FSA recognised that the proposed risk rating scheme and the new frequencies would take LAs some time to adjust to, especially as the current model has been in place for a long period of time.
The FSA also noted the selection of a shorter time period (six months instead of a year) was the right balance of testing without additional burden. As the FSA had already tested the effectiveness and amended the proposed model in England and Northern Ireland, the focus of this pilot evaluation was to ensure the refined proposed model worked in the Welsh context, and to test the new elements of the proposed model such as the allergen score.
2.3.3.2 Food Standards Agency reflections on the proposed model and on a potential further rollout
The FSA reported that the proposed food standards delivery model had run as expected. The LAs had adapted well to the proposed model with fewer clarification questions asked of the FSA during the pilot period than expected. The LAs did not identify any unintended consequences of the pilot or the proposed model.
The FSA identified that the interpretation and consistency issues (discussed in section 2.2.3) were the biggest challenge to effective implementation of the proposed model.
The FSA acknowledges that a period of transition will be needed to ensure LAs can acclimatise to the proposed new model if rolled out. The FSA have developed a suite of training packages to help LAs become familiar with the new model (these are currently being delivered to LAs in England and Northern Ireland following introduction of the new model there).
Throughout the pilot period the Welsh FSA pilot team shared feedback with the FSA’s Achieving Business Compliance (ABC) team to ensure the recommendations are reflected on the England and Northern Ireland wider roll out (and on the potential roll out of the proposed model in Wales). The FSA Welsh pilot team and ABC team have also been working closely with the performance management team and the Audit team to ensure other FSA services appropriately take account of any upcoming changes (and the pilot period itself). This reflects the FSAs awareness that the proposed model would take some time for LAs to adjust to. This has led to the development of a new set of KPIs relating to the proposed model which will be introduced if the proposed model is rolled out in Wales.
In light of these conversations, the FSA has noted the request for more guidance on:
- Scoring of premises with no allergen risk.
- Difference between scores (particularly between a 1 and a 2) for allergen criteria (this has been covered in the England and Northern Ireland guidance and associated training).
- Definitions on specific phrasing used (e.g. online and wide vs limited range has been covered in the England and Northern Ireland guidance).
- Implementation of the proposed model for LAs operating joint services, explaining the scheduling of interventions through the comparison of intervention frequency reports for food standards and food hygiene. Verbal guidance was provided during the pilot period, but written guidance is identified as beneficial.
- Service planning due to the need to have a more dynamic team with the proposed shorter intervention frequencies (this was also a key point from the initial pilot and non-prescriptive guidance has been developed on this).
The FSA mentioned that the proposed model would require a balance between having prescriptive guidance and allowing flexibility for food standards officers to use their knowledge and experience to risk rate a food business. Further, the training and preparation for a full roll out would be different to the pilot preparation (see section 3.2.1).
2.4 Research Question 3: What has been the effect on resources for each of the stakeholders because of the proposed model?
LAs discussed resourcing in terms of:
- The pilot period: it was reported that there was no change in resourcing caused by the pilot or the proposed model during the pilot period. One LA made a resourcing change during the pilot period, and this was to support efforts to reduce the backlog of interventions not due to the proposed model.
- A potential wider roll out: concerns were raised around how to effectively plan and justify resourcing within annual service plans under the proposed model, particularly in light of external financial pressures on LAs.
It was mentioned that the proposed model would not address the shortage in resources and the backlog in inspections.
The answer to this question focuses on the changes made by the LAs and the FSA to adapt to the proposed model. This includes changes linked to the implementation of the pilot, and changes to resources linked to the delivery of the proposed model.
2.4.1 Resourcing the pilot
The pilot and proposed model did not affect the resourcing needs of the LAs. Across the four LAs resources have changed very little during the pilot process. The pilot leads within the LAs have stayed consistent (although one has had a change in job title with no impact on the food standards role).
Only one LA experienced any change in resources during the pilot period. The LA brought in a consultant in December 2023 to assist with solving the backlog of interventions. This consultant did participate in interventions under the pilot model but the LA emphasised that this change in resource would have happened regardless of the pilot and was not caused by the proposed model.
The FSA’s role in supporting the LAs in the preparation and throughout the pilot was as expected. The FSA received fewer queries than anticipated.
2.4.2 Resourcing for a potential wider roll out of the proposed model
Both pilot LAs expressed concerns around resourcing for the potential future roll out of the proposed model due to the potential for increases in inspection frequencies and concerns around service planning (however, they did not require additional resources during the pilot).
The joint service pilot LA were particularly concerned about how they would create service plans to help make decisions and justify resource needs for the coming year. This was in the context of local authority spending cuts and tight budgets.
This LA explained that under the current model the shortest food standards intervention frequency was 12 months so the LA could work out how many ‘A’ rated priority premises there were and then look at how many food hygiene interventions were needed that year to align them. However, the proposed new model may require some one, three and six month visit frequencies so the LAs feel that they will be less able to accurately forecast how many interventions will be required throughout the year. While this is a reasonable worry, as shown in the section below (section 2.5.1.5) the reality is that not that many establishments were categorised with higher risk rating frequencies.
While joint service LAs aim to align their food standards and food hygiene interventions wherever possible to make most efficient use of resources this is not foreseen in the Code. The joint service LA was concerned that the proposed shorter intervention frequencies would reduce opportunities for alignment, therefore increasing the number of intervention visits required of the LA. Data from the joint service pilot LA showed that under the proposed model only 12% of food standards inspections were due before the food hygiene inspection. Therefore, this data shows that the proposed model is likely to have a limited impact on how many standalone food standards inspections the joint service LAs will need to conduct.
When discussing the resources required, LAs explained that they valued better targeting of their resources thanks to the proposed model. However, they perceived that the same number of staff would be required to deliver the proposed model, which is as expected. The main change would be that the proposed model would enable LAs to be more effective at prioritising food standards work and identifying and resolving non-compliances with food law.
In view of a potential roll out of the proposed model the FSA would need to consider internal resourcing for supporting LAs in adapting to the proposed new model. The FSA noted that this support is likely to be guided by the number of different MIS providers used by LAs and support provided in a group setting.
2.5 Research Question 4: What has been the overall effect of the proposed model? Did it deliver its objectives? Were there any unintended consequences?
The proposed model achieved its objectives of effectiveness, efficiency and impact:
- Effectiveness: The compliance scoring aspect of the proposed new risk assessment helped LAs target interventions and resource towards businesses that posed the most risk.
- Effectiveness: Quantitative data showed that pilot LAs identified significantly more allergen related issues than the control LAs, showing the value of the proposed standalone allergen information risk factor.
- Effectiveness: Quantitative data showed that the proposed risk decision matrix allowed premises to be categorised across a wider range of intervention frequencies, taking into account the business inherent risk and the assessed level of compliance. Overall number of interventions due increased by 14%.
- Efficiency: LAs feel that the model does ensure that the resources available are used most efficiently to target the highest risk food businesses and enables better prioritisation of revisits to ensure rectification of non-compliances.
- Impact: The proposed new shorter (1, 3 and 6 months) and longer (72 and 120 months) frequencies within the proposed risk matrix were identified for a range of food business types during the pilot. Therefore, the risk matrix is allocating intervention frequencies which are better aligned with compliance scores than previously (the inherent risk score appears to have a stronger influence on intervention frequencies under the current delivery model), meaning that intervention frequencies align better with the risks faced.
- Impact: The pilot and proposed model had very little effect on relationships between LAs and FSA and no effect on relationships between LAs and businesses.
Through analysis of the qualitative interview data and quantitative data the evaluation did not identify any unintended consequences of the pilot or proposed model.
This section summarises the effects of the proposed model, namely whether it achieved its objectives:
- Effectiveness: Identifying food businesses that pose the greatest risk and targeting interventions more effectively.
- Efficiency: Resources are better targeted by prioritising interventions in establishments that pose the greatest risk.
- Impact: LAs have a greater degree of flexibility to use intelligence and respond to where the highest risk of non-compliance is.
The evaluation team also assessed whether there had been any unintended consequences caused by the proposed model. This section draws together data supplied to the FSA by LAs engaged in the pilot and qualitative data from LA post-pilot interviews. It should be noted that the FSA quantitative data was only available for businesses which received an intervention during the pilot period and did not cover the full set of premises within the LAs area. Additionally, the short time span of the pilot and small sample number of LAs presented limitations to analysing the quantitative data. This has made it difficult to reach definitive conclusions on some aspects of the proposed model, as explained in the sections below.
2.5.1 Effectiveness
The proposed model has performed as expected, allowing LAs to better identify and prioritise high-risk food businesses for interventions. The proposed approach to combining the inherent risk and compliance in a way which emphasises the compliance score offered a more balanced approach to identifying risk and allocating intervention frequencies. This was identified as a positive element because businesses are not rigidly limited to always being in the same risk category.
The rest of the section reviews the impact of the proposed model on changes in non-compliance and changes in frequency of interventions.
2.5.1.1 Comparison in identification of non-compliant businesses
A key finding of the initial pilot was that the proposed model was able to identify and prioritise businesses with lower compliance levels for interventions through the scoring system (with the assurance rule) and the new intervention frequencies.
To understand how the proposed model impacted on which businesses were identified for intervention within the pilot period and whether these businesses were more likely to be non-broadly compliant (NBC), the difference in businesses rated NBC during the pilot period by both the pilot LAs and the control LAs can be compared. This analysis compares compliance under the current Code definition of “broadly and non-broadly compliant”. The definition of “broadly and non-broadly compliant” can be found in annex section A1.2.
When looking at how the proposed model performed in Wales under the current definition of NBC the pilot LAs had an NBC rate of 43% and the control LAs had an NBC rate of 18%. A chi-squared test was performed on the difference between the control and pilot LAs and this was significant at the 5% significance level. This showed that the premises visited in the pilot LAs were more likely to be NBC than for the control LAs. However, the differences in NBC rate between the two pilot LAs and the two control LAs was bigger than the difference between the two groups as a whole. Therefore, local contexts have also made a large contribution to the NBC rate. This is shown in Figure 2.1 below.
These figures exclude interventions where a risk assessment was not carried out and businesses that were found to be permanently closed.
Figure 2.1 The proportion of broadly and non-broadly compliant businesses - using the Code definition identified by the control and pilot LAs during the pilot period (source: data collected by the FSA during the pilot period)
2.5.1.2 The allergen information risk factor
The allergen information risk factor was added to the three other factors which make up the compliance score as a result of feedback from the initial pilot where it was felt that a more direct focus on allergen practices was needed.
Data gathered by the FSA during the pilot period showed that the pilot LAs reported significantly more allergen related issues than the control LAs (A chi-squared test was performed on the difference between the control and pilot LAs at the 5% significance level). There were 55 mentions (28% of premises that had interventions) of allergen issues in the pilot group (26 of which were for non-compliant businesses) and 24 (13% of premises that had interventions) mentions in the control group (14 of which were for non-compliant businesses). This aligns with the qualitative data where pilot LAs said that the proposed model gave a more proportional focus on allergens and helped to specifically highlight where allergens and related practices were an issue (see section 2.2.1.1).
Both pilot LAs reported that they were expecting to identify more non-compliances than they found during the pilot period due to the new allergen information risk factor. They noted that inconsistencies in interpretation of the allergen scoring guidance may have had an impact on the levels of non-compliance found, see section 2.2.3 for further details on the allergen guidance.
However, the quantitative data showed that, when considered in isolation, the allergen information compliance factor had a small impact on the overall compliance rating. Out of 334 premises, which had interventions where a risk assessment score was given, the addition of the allergen information risk factor, overall led to the compliance score increasing for 19 businesses (5.7%) and decreasing for one (0.3%). Three of these premises received an allergen information risk factor score of one, of these two premises also had at least one other compliance factor of one meaning the overall compliance score did not change. Due to the assurance rule, the third business overall compliance score did change due to the allergen information risk factor score (see Annex 1 for more information on the assurance rule).
2.5.1.3 Interventions resulting in follow-up action
Under the proposed model it would be expected that there was an increase in follow-up action (at least in the short term) due to the model being expected to more effectively identify and prioritise high-risk premises for intervention.
However, the quantitative data showed that significantly more premises received follow up action from the control LAs (44%) than the pilot LAs (34%). A chi-squared test was performed on the difference between the control and pilot LAs and this was significant at the 5% significance level. When minor actions such as ‘advice letters’ and ‘advice & guidance’ were excluded the difference between the control LAs and pilot LAs was no longer significant. This suggests that the control LAs used minor follow up actions more often than the pilot LAs. It should be noted that (similarly to the level of “non-broadly compliant” premises) the differences between the two pilots and the two controls were larger than the difference between the two groups. Therefore, it is unclear how the proposed model impacted on follow up action.
Figure 2.2 below shows the follow up action rates for each participating LA. An action was counted if one or more of the following categories of actions were carried out:
- Action in relation to non-compliance
- Advice letter
- Advice and guidance
- Business advice/support,
- Further compliance checks,
- Intelligence report issued to IDB
- Notified FSA
- Notified Primary Authority
- Ongoing investigation
- Referral - Local Authority
- Referral - Other
- Revisit
- Request for 3rd party action (e.g. ISP/selling platform action)
- Sampling activity
- Share information/intel
- Voluntary surrender
- Warning letter
- Warning notice given at the time
- Website takedown
Figure 2.2 The proportion of interventions that had a follow up action (source: data collected by the FSA during the pilot period)
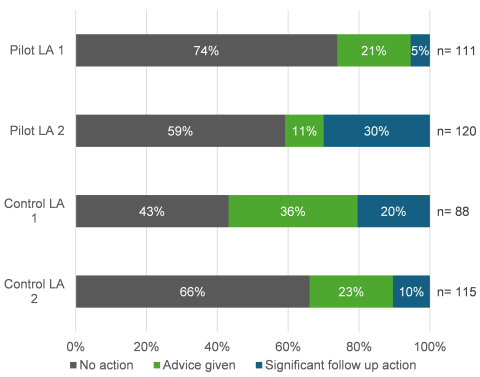
Bar chart to compare the proportion of interventions that required follow up action for each pilot and control LA. Pilot 1 had 74% of interventions with no follow up action, 21% where advice was given and 5% where significant follow up action was required. Pilot 2 had 59% of interventions with no follow up action, 11% where advice was given and 30% where significant action was required. Control 1 had 42% of interventions where no action was required, 36% where advice was given and 20% where significant action was required. Control 2 had 66% of interventions where no action was required, 23% where advice was given and 10% where significant action was required.
2.5.1.4 Change in ratio of proactive and reactive interventions
During the pilot period, data shows that there was no significant difference in the ratio of proactive and reactive interventions between the pilot and control LA groups:
- Pilot: 333 (94%) proactive: 20 (6%) reactive
- Control: 199 (88%) proactive: 26 (12%) reactive
A chi-squared test was performed on the difference between the control and pilot LAs at the 5% significance level. Figure 2.3 below shows the proportions of proactive and reactive interventions by each participating LA.
An intervention is classed as reactive when it is prompted by receipt of intelligence (such as a complaint), whereas an intervention is proactive if it is part of the planned programme of official controls which is determined based on the outcome of the previous official control (this data excludes advice and information gathering for Primary Authorities as well as interventions where data is not known). However, the proposed model also now defines revisits as proactive interventions meaning that over a longer period than the 6-month pilot (where there was limited time available for revisits to take place) it would be expected that the proposed model would cause LAs to increase the number of interventions classed as proactive.
This data is likely influenced by one of the control LAs being the regional intelligence coordinator in Wales who have a higher-than-average use of intelligence. It should also be noted that the Welsh pilot, unlike the initial pilot, did not include a directed focus on piloting use of intelligence, therefore it was less likely that a change in ratio would be identified in comparison to the initial pilot findings.
Figure 2.3 The proportion of proactive and reactive interventions for the control and pilot LAs. (source: data collected by the FSA during the pilot period)
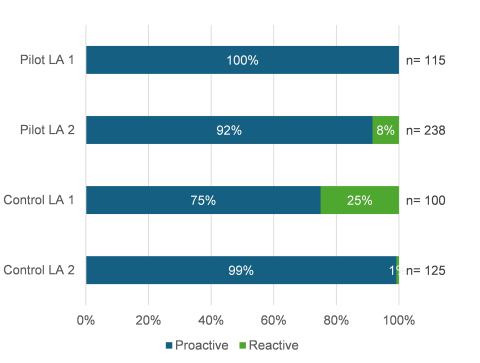
Bar chart to compare the proportion of proactive and reactive interventions for each pilot and control LA. Pilot 1 had 100% proactive interventions. Pilot 2 had 92% proactive and 9% reactive interventions. Control 1 had 75% proactive and 25% reactive. Control 2 had 99% proactive and 1% reactive.
2.5.1.5 Changes in frequency of intervention
Pilot LAs were asked to risk rate food businesses under both the current and proposed food standards delivery models. This enabled direct comparison of how intervention frequencies (the time between interventions) would vary between the current and proposed models.
The proposed model introduced a higher range of intervention frequencies, going from three options (12, 24 and 60 months) to ten options in the proposed model (1, 3, 6, 12, 24, 36, 48, 60, 72, and 120 months). Some LAs were concerned about the implications of both the new shorter intervention frequencies and the new longer intervention frequencies in terms of resourcing and the ability to keep in regular contact with food businesses.
The FSA quantitative data showed that the proposed model recategorised the intervention frequency for 75% of premises. Figure 2.4 shows how those businesses were recategorised.
The recategorisation led to the number of interventions due (scheduled for an intervention within the next 12 months) increasing overall by 14%. This was due to the number of businesses with new shorter-term frequencies exceeding the number of establishments with longer frequencies. It is the intention of the model that in practice premises would not remain on such short intervention frequencies but would resolve issues and improve compliance levels as a result of the increase inspection frequency for poorly compliant businesses. This would then reduce the required intervention frequency, within the year as business compliance improves.
Figure 2.4 Comparison of how business’s intervention frequency change under the proposed model compared to the current model - n= 328 as not all interventions were scored under the current model by the pilot LAs. (source: data collected by the FSA during the pilot period)
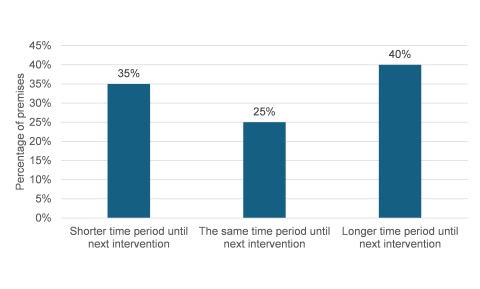
A bar chart showing overall how the intervention frequencies for businesses changed under the proposed model. 35% had a shorter time period until next intervention, 25% had the same time period (no change), and 40% had a longer time period until next intervention.
To understand how the workload of the pilot LAs changed, analysis was done to compare the intervention frequency for food businesses under the current model with the intervention frequency generated by the decision matrix under the proposed model (using scoring from the same intervention during the pilot). The figures below compare how the intervention frequency changed for premises under the proposed model in comparison to the current model. There is a figure for each of the current frequencies:
- 12 months (12 months = current Category A premises, high risk) (Figure 2.5),
- 24 months (24 months = current Category B premises, medium risk) (Figure 2.6),
- 60 months (60 months = current Category C premises, low risk) (Figure 2.7).
Figure 2.5 Comparison of intervention frequencies generated by the proposed model for all premises categorised as a 12-month intervention frequency (Category A) under the current Code - n=13. (source: data collected by the FSA during the pilot period)
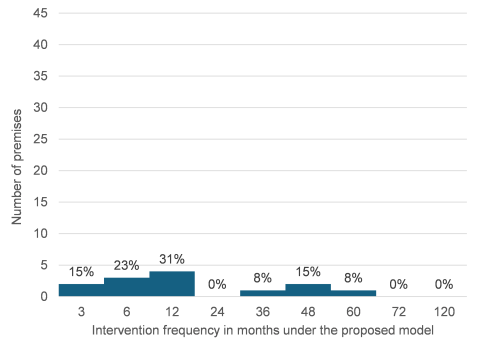
A bar chart showing the percentage of businesses with different intervention frequencies under the proposed model who were previously categorised as a 12 month intervention frequency. 15% of these premises increased in frequency to 3 month frequencies, 23% increased to a 6 month frequency, 31% stayed at a 12 month frequency, 8% decreased frequency to 36 months, 15% decreased to 48 month frequency, 8% decreased to 60 months.
Figure 2.6 Comparison of intervention frequencies generated by the proposed model for all premises categorised as a 24-month intervention frequency (Category B) under the current Code - n=144. (source: data collected by the FSA during the pilot period)
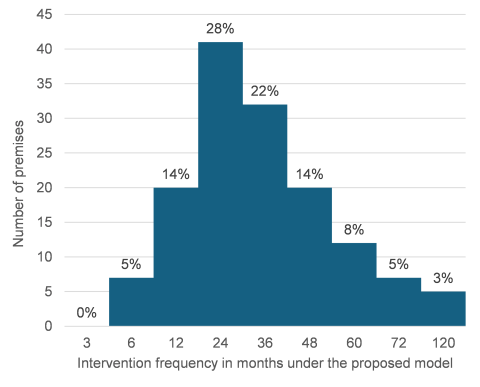
A bar chart showing the percentage of businesses with different intervention frequencies under the proposed model who were previously categorised as a 24 month intervention frequency. 5% of these premises increased in frequency to 6 month frequencies, 14% increased to a 12 month frequency, 28% stayed at a 24 month frequency, 22% decreased frequency to 36 months, 14% decreased to 48 month frequency, 8% decreased to 60 months, 5%decreased to 72 months and 3% decreased in frequency to 120 months.
Figure 2.7 Comparison of intervention frequencies generated by the proposed model for all premises categorised as a 60-month intervention frequency (Category C) under the current Code - n=171. (source: data collected by the FSA during the pilot period)
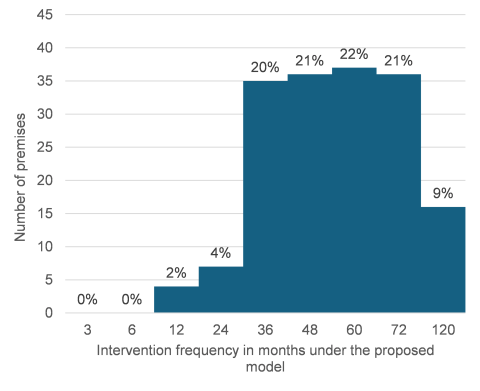
A bar chart showing the percentage of businesses with different intervention frequencies under the proposed model who were previously categorised as a 60 month intervention frequency. 2% of these premises increased in frequency to 12 month frequencies, 4% increased to a 24 month frequency, 20% increased to a 36 month frequency, 31% increased to a 48 month frequency, 22% stayed at a 60 month frequency, 21% decreased frequency to 72 months and 9% decreased in frequency to 120 months.
Data showed that the proposed risk decision matrix allowed premises to be categorised across a wider range of intervention frequencies, taking into account the business inherent risk and the assessed level of compliance. The proposed model categorised a varied range of food business types under the newly proposed shorter intervention frequencies (1, 3 and 6 months), and the new longer intervals (72 and 120 months). In addition to these longer/shorter frequencies businesses may fall into 36 or 48 month interventions depending on their risk rating. See Annex 2: Table A2.1 to see a breakdown of how each food business type was categorised across the 10 intervention frequencies under the proposed model.
This range of food business types and lack of pattern suggests that the proposed model is categorising based on both inherent risk and compliance scores rather than mainly by inherent risk under the current model. This should then enable LAs to target their resource where it will be most effective at reducing non-compliances.
2.5.1.6 Takeaways
Prior to the pilot period, the pilot LAs expressed concern that there could be increases in intervention frequency for many of their takeaway premises, as the LAs felt takeaways were one of their most high-risk categories of premises. LAs were concerned that this increase would put a considerable strain on resources. Under the current model, LAs felt that the risk posed by takeaways was not fully appreciated as most takeaways may have an intervention frequency of 24 months and then for non-compliances 12 months, therefore it was felt that the proposed model was likely to increase frequencies. However, qualitative interview data shows that both pilot LAs reported that the change in intervention frequencies for takeaways was not as evident as expected. Analysis of the quantitative data showed that 25 (38%) out of 65 takeaways receiving interventions during the pilot had an increase in intervention frequency, 23 (35%) out of 65 takeaways had no change in intervention frequency, and 17 (26%) out of 65 had a decrease in intervention frequency (See Annex 2: Table A2.2 for a breakdown of change in intervention frequency for takeaways). However, the overall number of interventions due for takeaways increased by 35% (this compares to 9% for all other premises types considered together). This range of variation likely shows that the changes in intervention frequency were caused by the level of compliance found on inspection rather than the inherent risk posed by the takeaway trade.
2.5.1.7 Manufacturers
One pilot LA expressed concern that the pilot would reduce intervention frequencies for large manufacturers. Although these manufacturers were often broadly compliant the LA officer was concerned about the impact of a lack of contact with the FBO and the nature of risks posed by such large distribution channels. An example of this is given in section 2.3.1.4.
Data collected by the FSA showed that two out of nine manufacturers receiving an intervention by a pilot LA during the pilot period had an increase in their intervention frequency, three out of nine had no change and four out of nine had a decrease in their intervention frequency (See Annex 2: Table A2.3 for a breakdown of change in intervention frequency for manufacturers). While it is acknowledged these are based on a small number of premises, when considered alongside the conclusions around intervention frequency change for takeaways, the data shows that the proposed model is more effective at differentiating the appropriate intervention frequency based on inherent risk and compliance levels in combination.
2.5.2 Efficiency
Section 2.4 considers the resource needs for the pilot itself and a potential wider roll out of the proposed model. As stated previously, the proposed model will not alleviate any pre-existing issues relating to resourcing of food standards teams, nor was it intended to. LAs feel that the model does ensure that the resources available are used most efficiently to target the highest risk food businesses and enables better prioritisation of revisits to ensure rectification of non-compliances. The quantitative data shown in section 2.5.1 also supports this as only 25% of interventions remained unchanged meaning that 75% of interventions changed, likely to be more in line with the level of risk they present.
2.5.3 Impact
Whilst the quantitative data around non-compliances was inconclusive (see section 2.5.1.1) the qualitative evidence showed that the proposed risk scheme allowed officers to assess the risk of food businesses more accurately (in the opinion of food standards officers) and determine their intervention frequency based on the officers’ professional assessment of risk posed by the food business. There is less potential for a food business’s compliance level to impact the frequency of the next intervention under the current system as it is primarily driven by the inherent risk of the business. Under the proposed risk scheme officers can use their knowledge of a food business’s previous performance and management to assess the risk posed by these businesses and determine the appropriate intervention frequency.
Further, quantitative data suggested that the proposed model generates the expected impact of assisting LAs to more effectively target resource where there is most risk and more granular scoring of food businesses through the proposed compliance scoring criteria. This is shown in section 2.5.1.5 where intervention frequencies for all food business types as well as for takeaways and manufacturers (food business types specifically of concern to the pilot LAs identified in interviews) appears to have spread fairly evenly across the proposed new intervention frequencies. Additionally, the introduction of the assurance rule means that if a food business has a poor level of compliance in one of the compliance factors (therefore given a score of 1), the overall compliance risk is given a score of 1 leading to a short intervention frequency of 1, 3, 6 or 12 months. This will ensure LAs prioritise that next intervention to ensure any non-compliances are rectified.
2.5.3.1 Impact of the pilot on relationships
In terms of the relationship between the FSA and LAs, one pilot LA and one interviewee from the other pilot LA felt that the pilot had had no impact on their relationship with the FSA. However, the other interviewee from the pilot LA reported that the pilot had made them feel ‘a little more positive towards the FSA’.
Both LAs reported an increase in frequency of communication with the FSA and found the FSA to be communicative and available when needed.
Both pilot LAs felt that the proposed model did not (and would not) change any relationships with FBOs. They noted that some FBOs are more aware of when the LA visits than others but any change is due to the individual rather than the proposed model.
2.5.4 Unintended consequences
There were no unintended consequences identified during the pilot period.