Prosiect ymchwil
Consumer Insights Tracker (April 2024 to June 2024)
The Consumer Insights Tracker is an online monthly tracking survey commissioned by the Food Standards Agency (FSA).
The Consumer Insights Tracker is an online monthly tracking survey commissioned by the Food Standards Agency (FSA). It monitors the behaviour and attitudes of adult consumers aged 16+ in England, Wales and Northern Ireland in relation to food.
The survey includes topics such as food availability, food affordability, consumer concerns in relation to food, confidence in the food supply chain and in the FSA as a regulator.
The full data set is published on data.food.gov.uk: Consumer Insights Tracker July 2023 - present.
Key findings for April-June 2024
- There has been a slow downward trend in the proportion worried about being able to afford food across the survey series, declining from 28% in July 2023 to 22% in February 2024. Figures have remained at a comparable level since then, with 22% reporting this in June 2024.
- Half (49%) report that they or someone else in their household chose cheaper alternatives rather than branded products to save money in June 2024, in line with April (51%) and May (48%).
- Looking at the data from April-June 2024 combined, the following groups are more likely to be worried about food availability: those from minority ethnic backgrounds (32% vs. 18% of white respondents), under 35s (27% vs. 11% of those aged 55+) and the most deprived IMD deciles (27% vs. 13% of those in the least deprived deciles).
- The top three concerns in June 2024 are food prices (88%), ultra-processed, or over-processing of food (77%), and food poverty and food inequality (76%). These figures were at comparable levels in April and May, and have consistently been the top three consumer concerns about food in the UK across all waves of the survey.
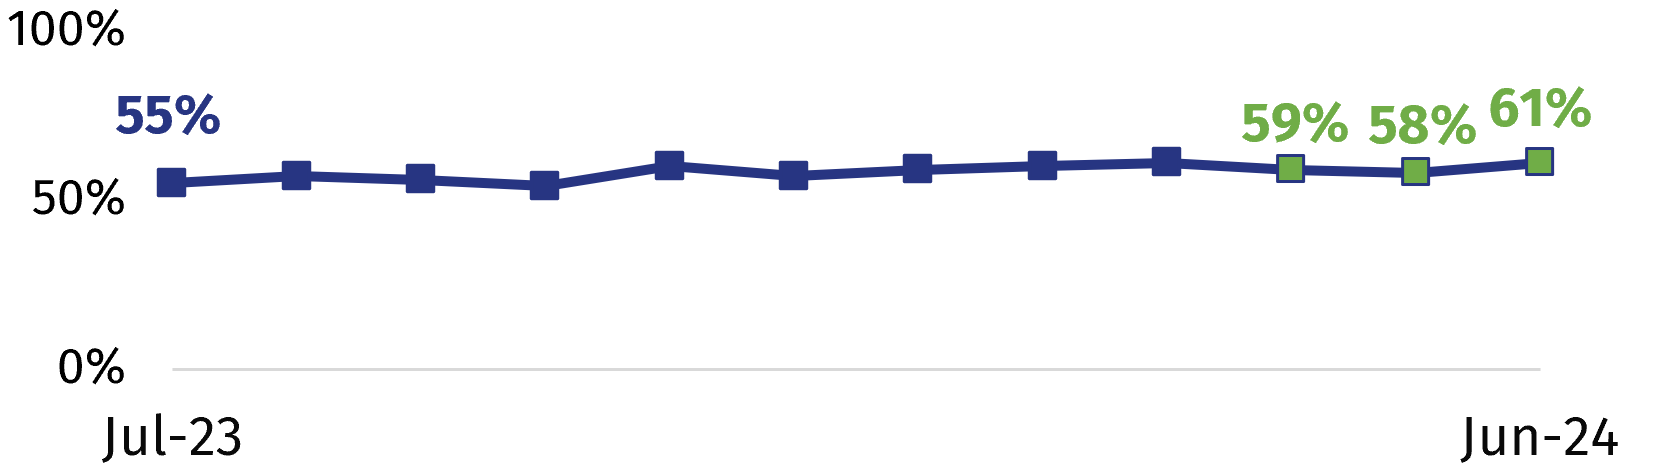
- 61% are confident in the food supply chain in June 2024, with comparable figures in April (59%) and May (58%). Confidence has remained stable since it rose to 60% in November 2023, having averaged 55% in the period July-October 2023.
- Around three in five had trust in the FSA to do its job from April-June 2024 (57% in June, and 60% in May and April). Confidence during these months that the FSA protects the public from food-related risks is around three-quarters (74% in June, and 77% in May and April).
Food affordability
From April-June 2024, the proportion saying they are worried about their household not being able to afford food in the next month remained broadly stable.
In June 2024, this figure is around one in five (22%), remaining broadly stable since January this year but representing a downwards trend since tracking began.
Proportion who reported worrying about their household not being able to afford food in the next month (footnote 1)
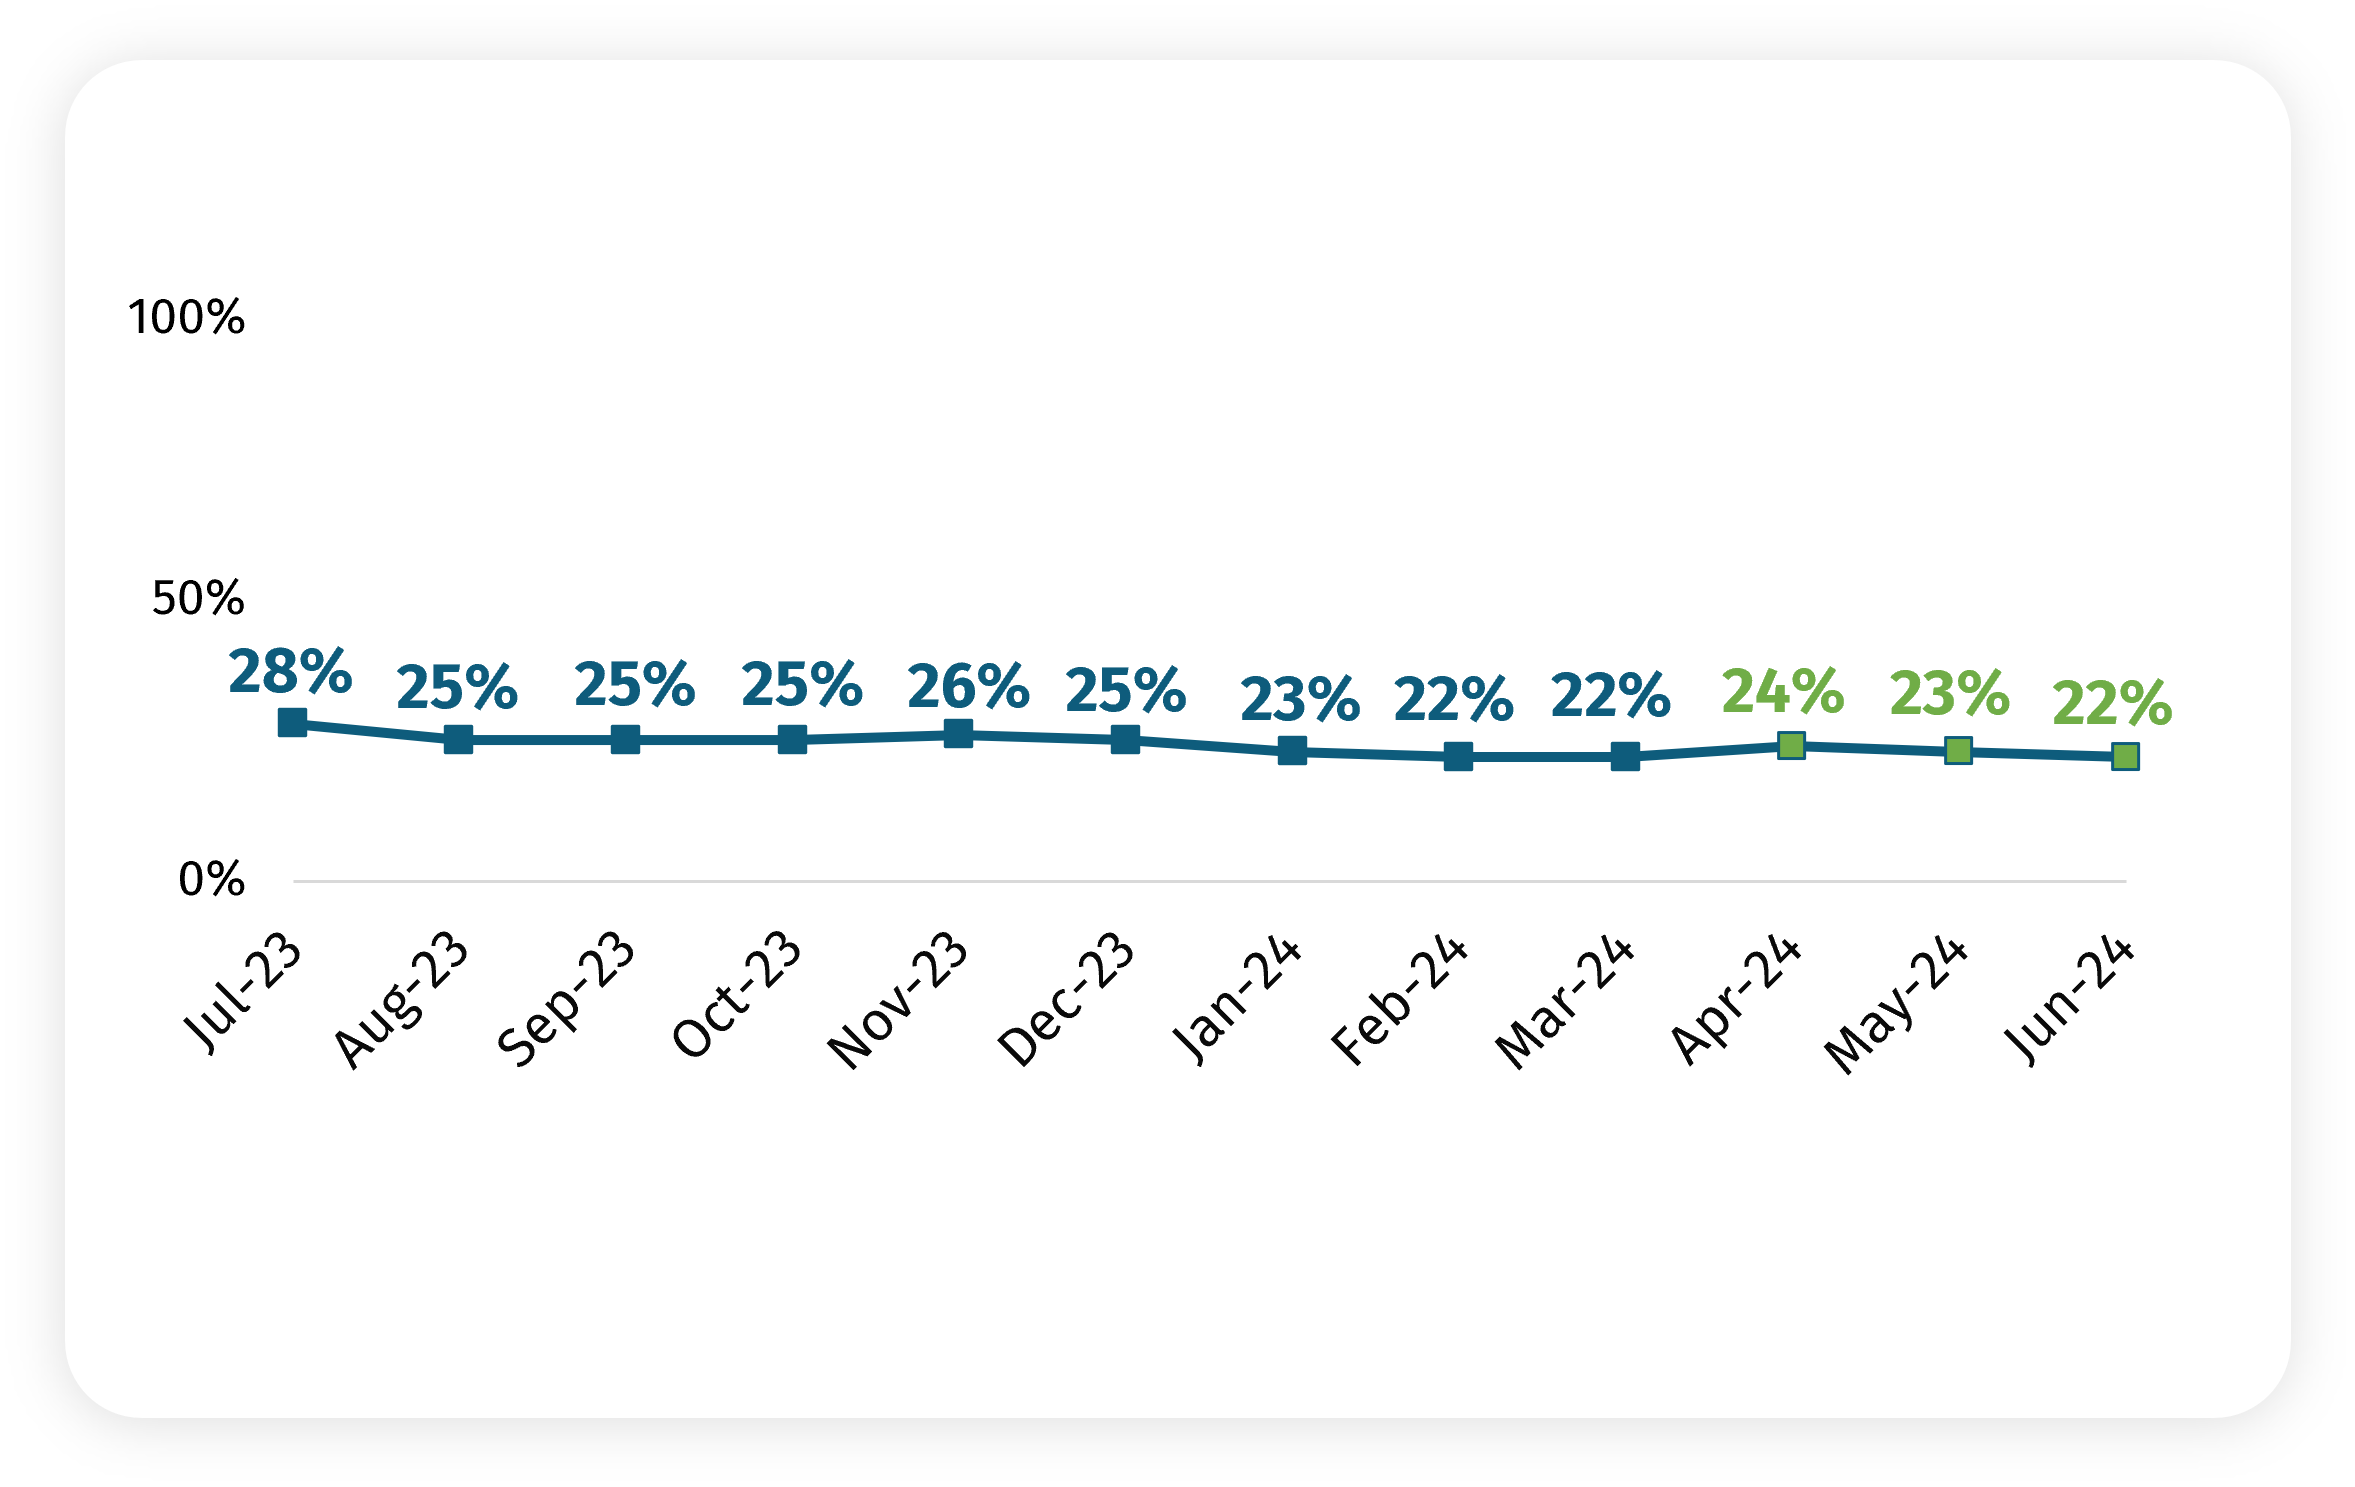
Note: The new data points (from April to June) are shown in a different colour. Statistically significant differences compared to May shown with arrows.
Food bank use
From April-June 2024, the proportion of respondents that reported that they or another member of their household received a free parcel of food from a food bank or other emergency food provider remained at 3%. This has remained comparable since tracking began.
Proportion who reported receiving a food parcel from a food bank or emergency food provider (footnote 2)
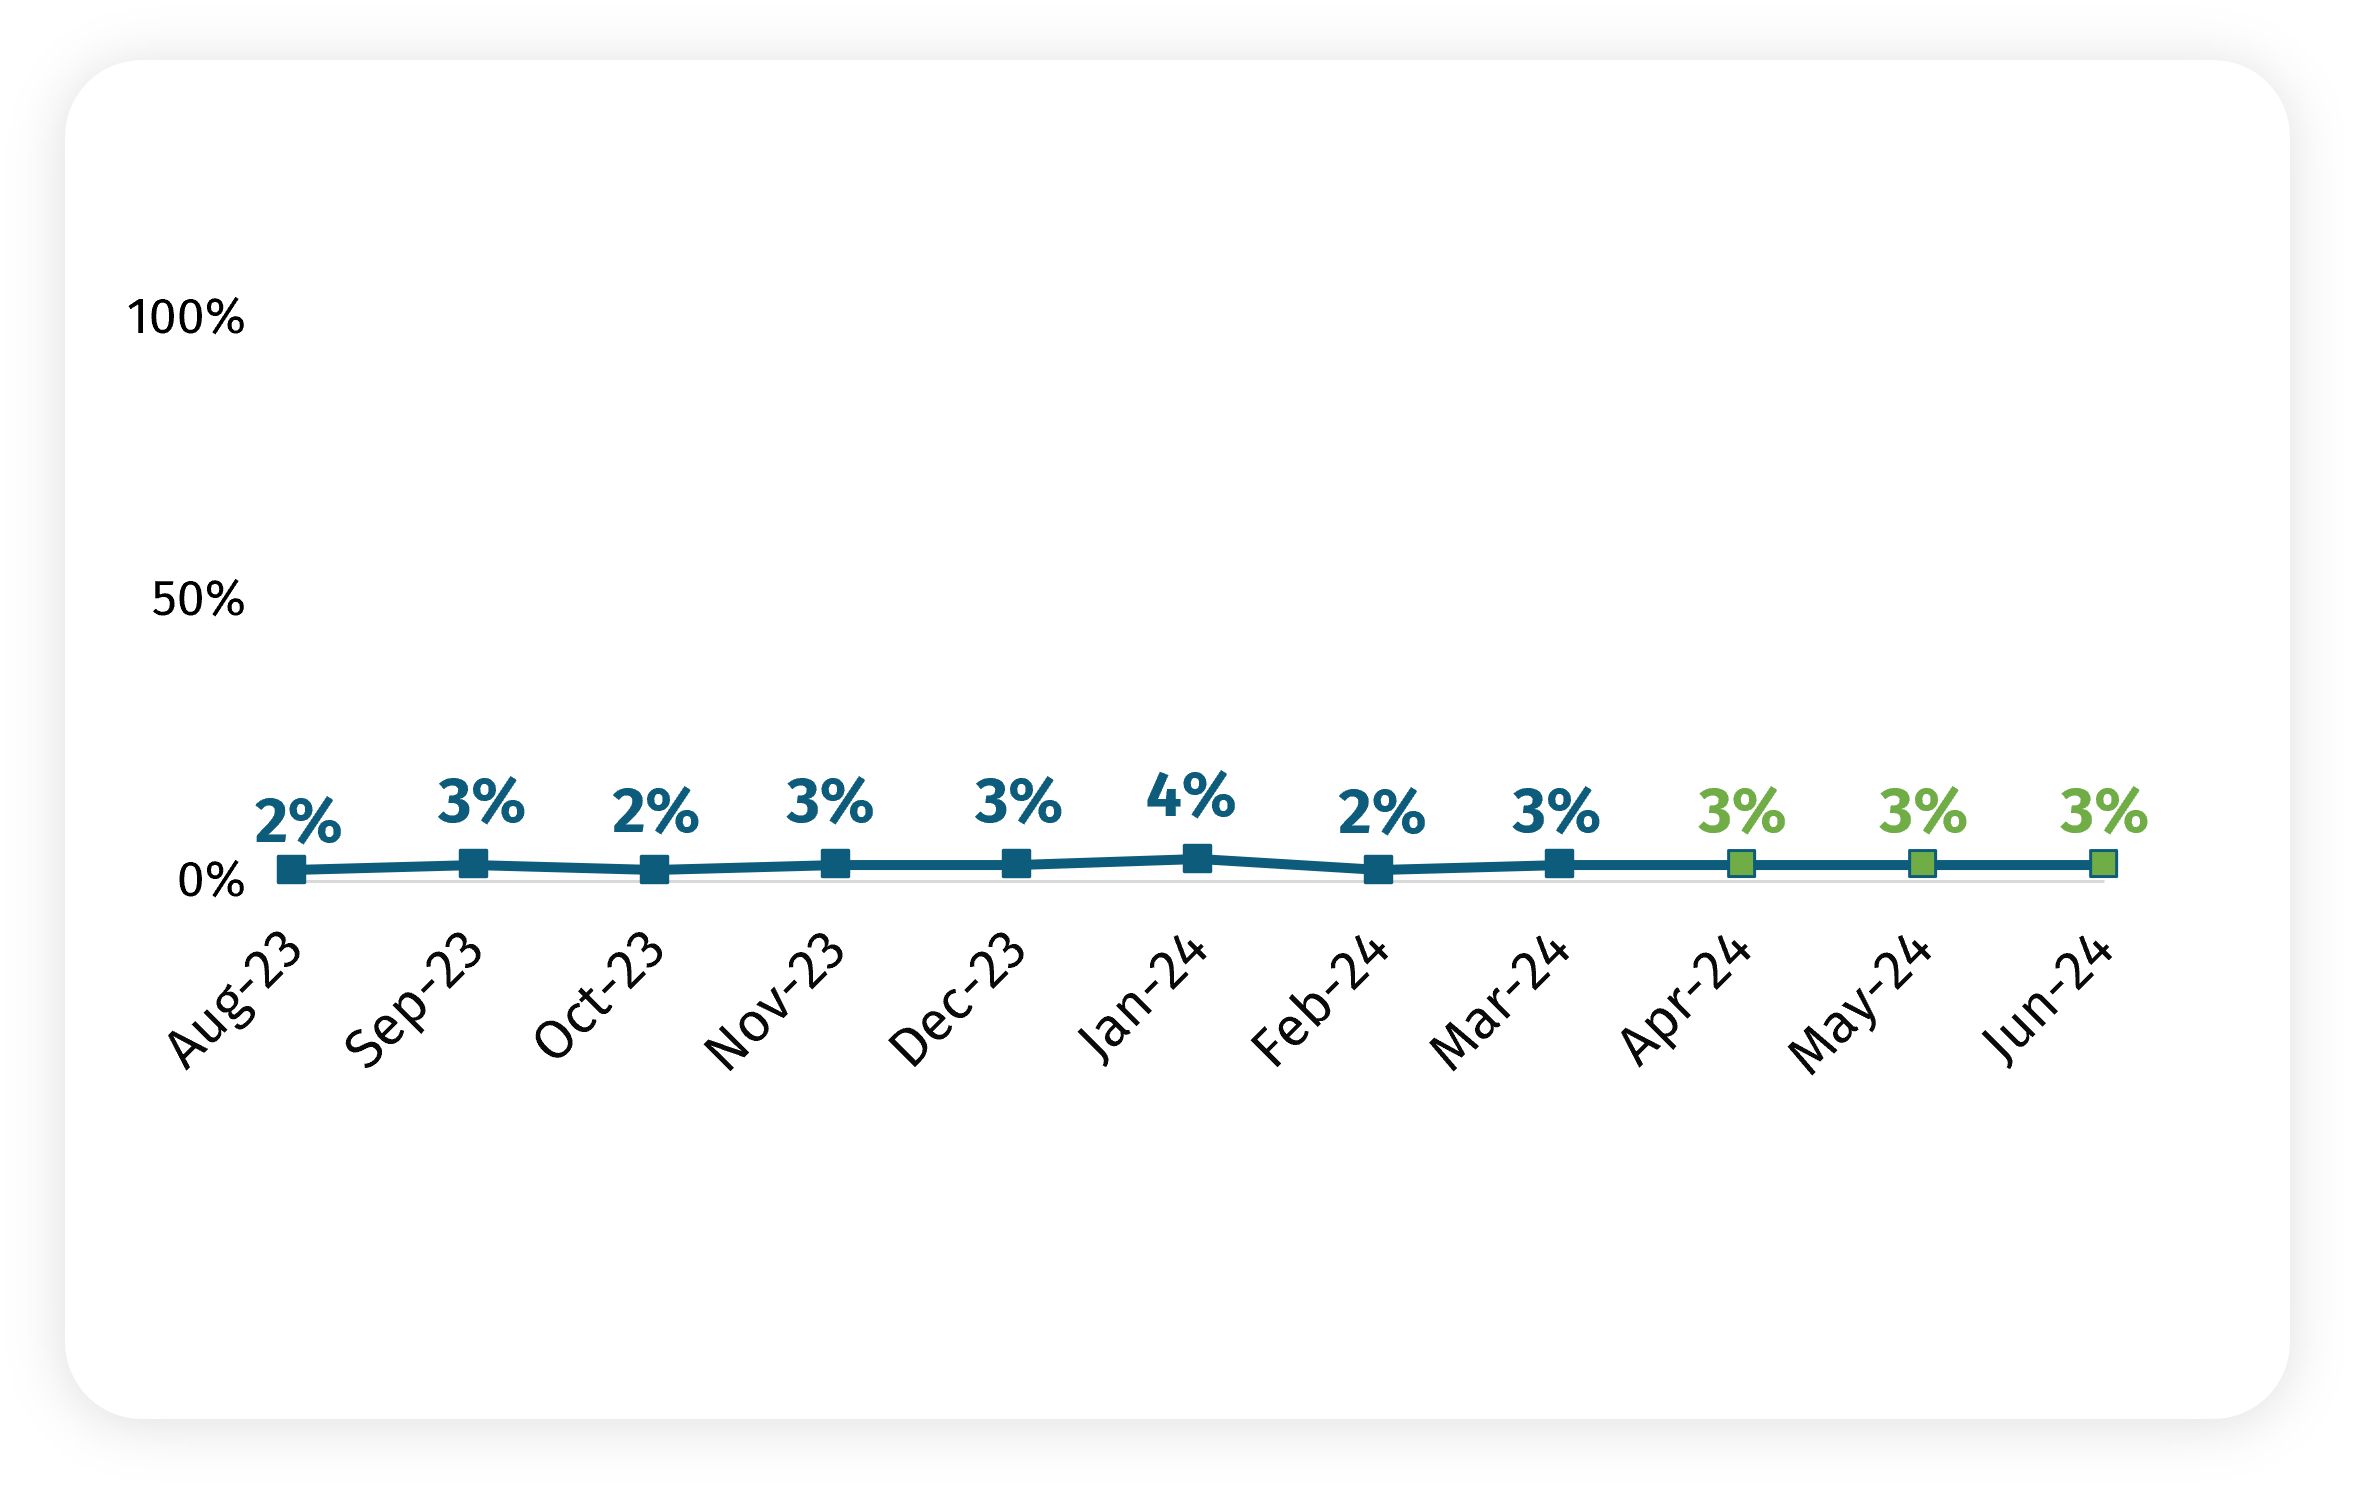
Note: The new data points (from April to June) are shown in a different colour. Statistically significant differences compared to May shown with arrows.
Shopping
The proportion reporting that at least one of the following statements applies to them or their household has remained relatively stable over time, at around two in three.
There was a slight increase in April (70%) though in May and June 2024 this figure is broadly comparable with earlier waves (May: 66% and June: 68%).
Reported shopping statements (footnote 3)
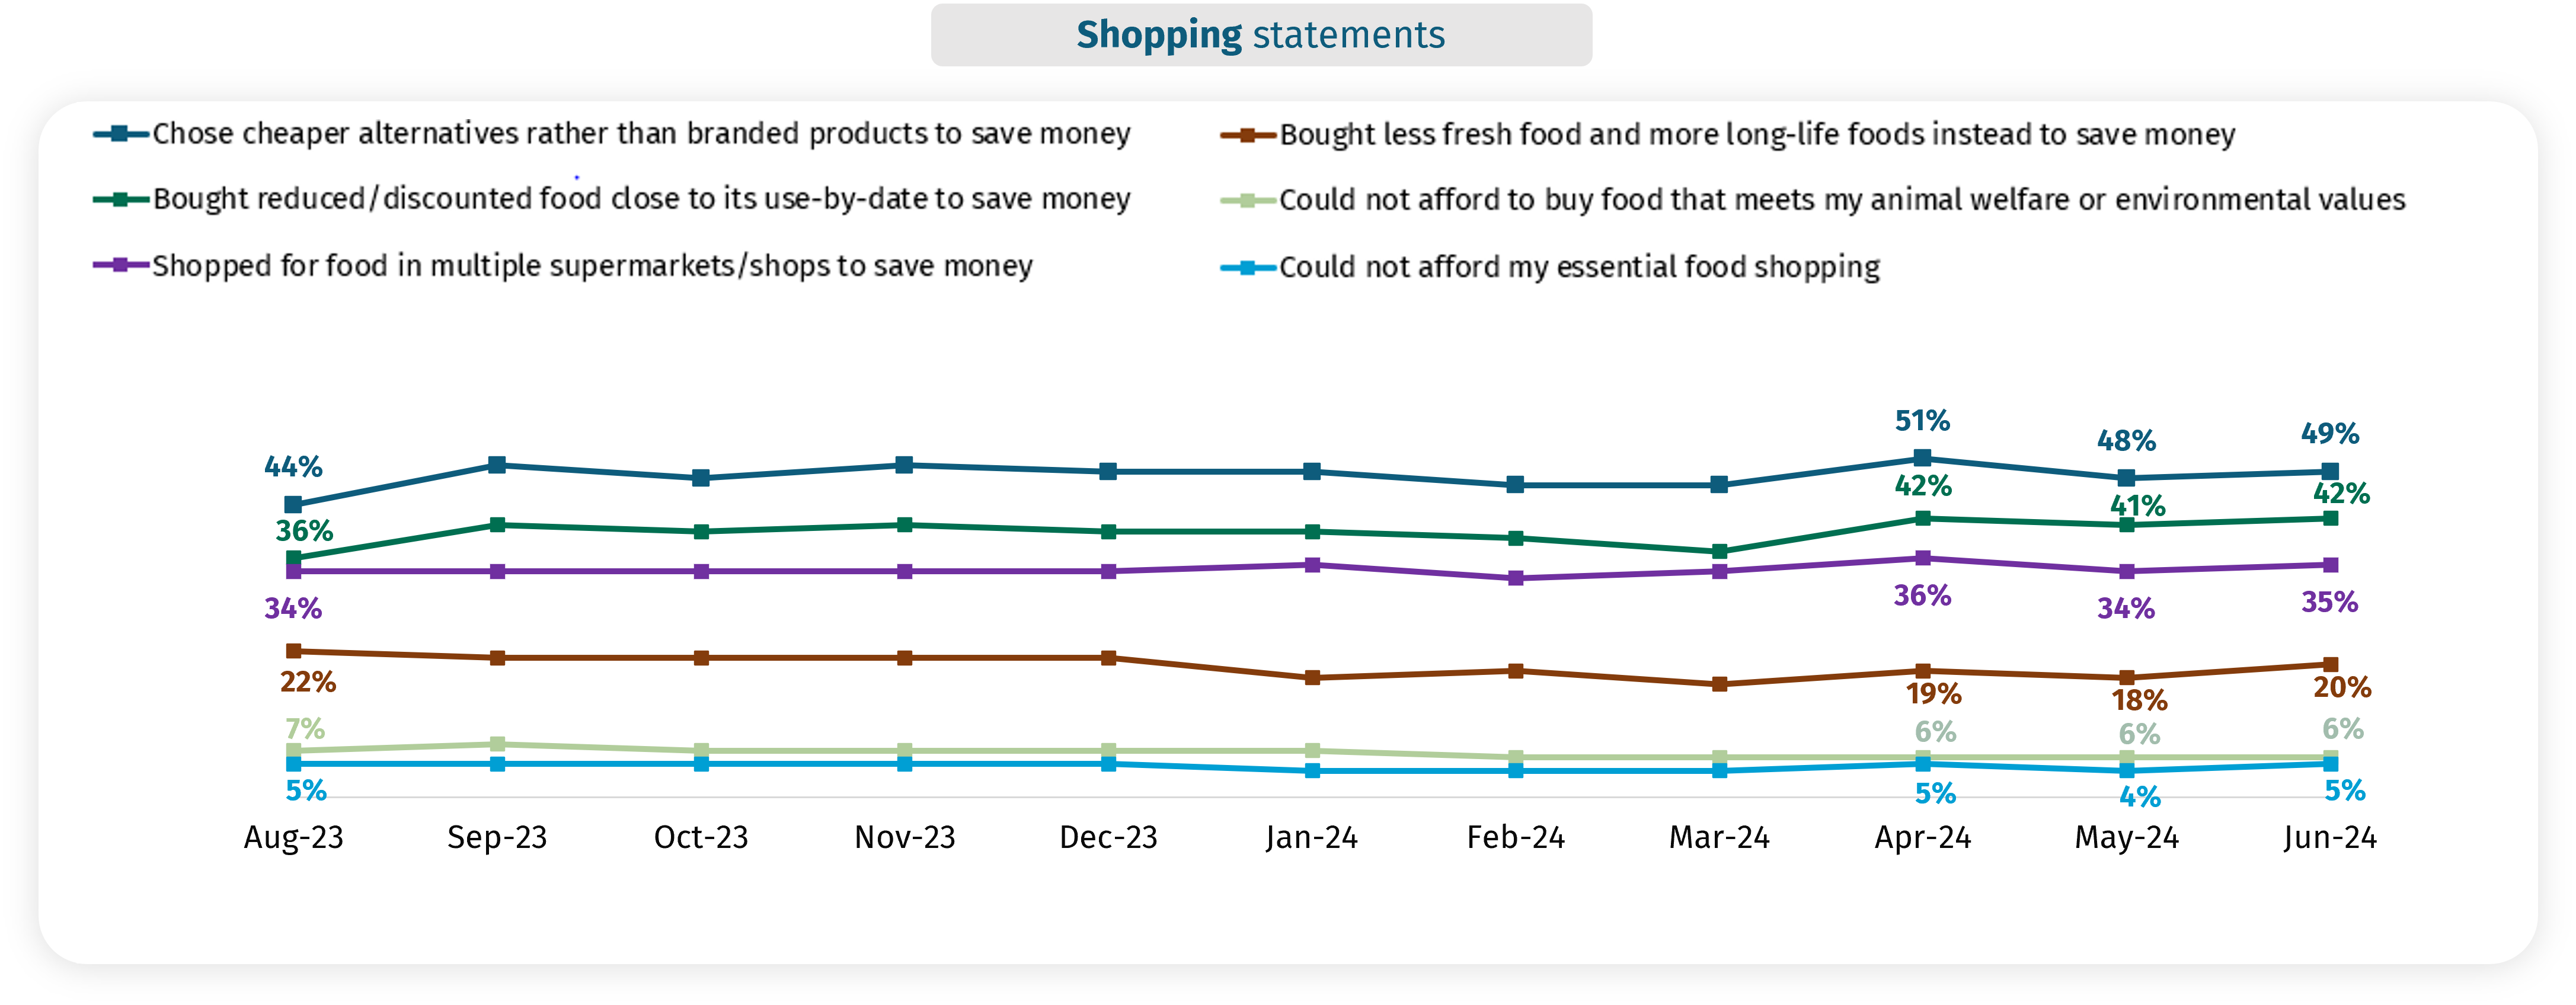
Statistically significant differences compared to May shown with arrows.
Cooking and eating
From April-June 2024, the proportion reporting they or someone else in their household cooked/prepared something from scratch, rather than buying it ready made to save money remained broadly stable.
Proportion who had the following apply to them or someone else in their household (footnote 4)
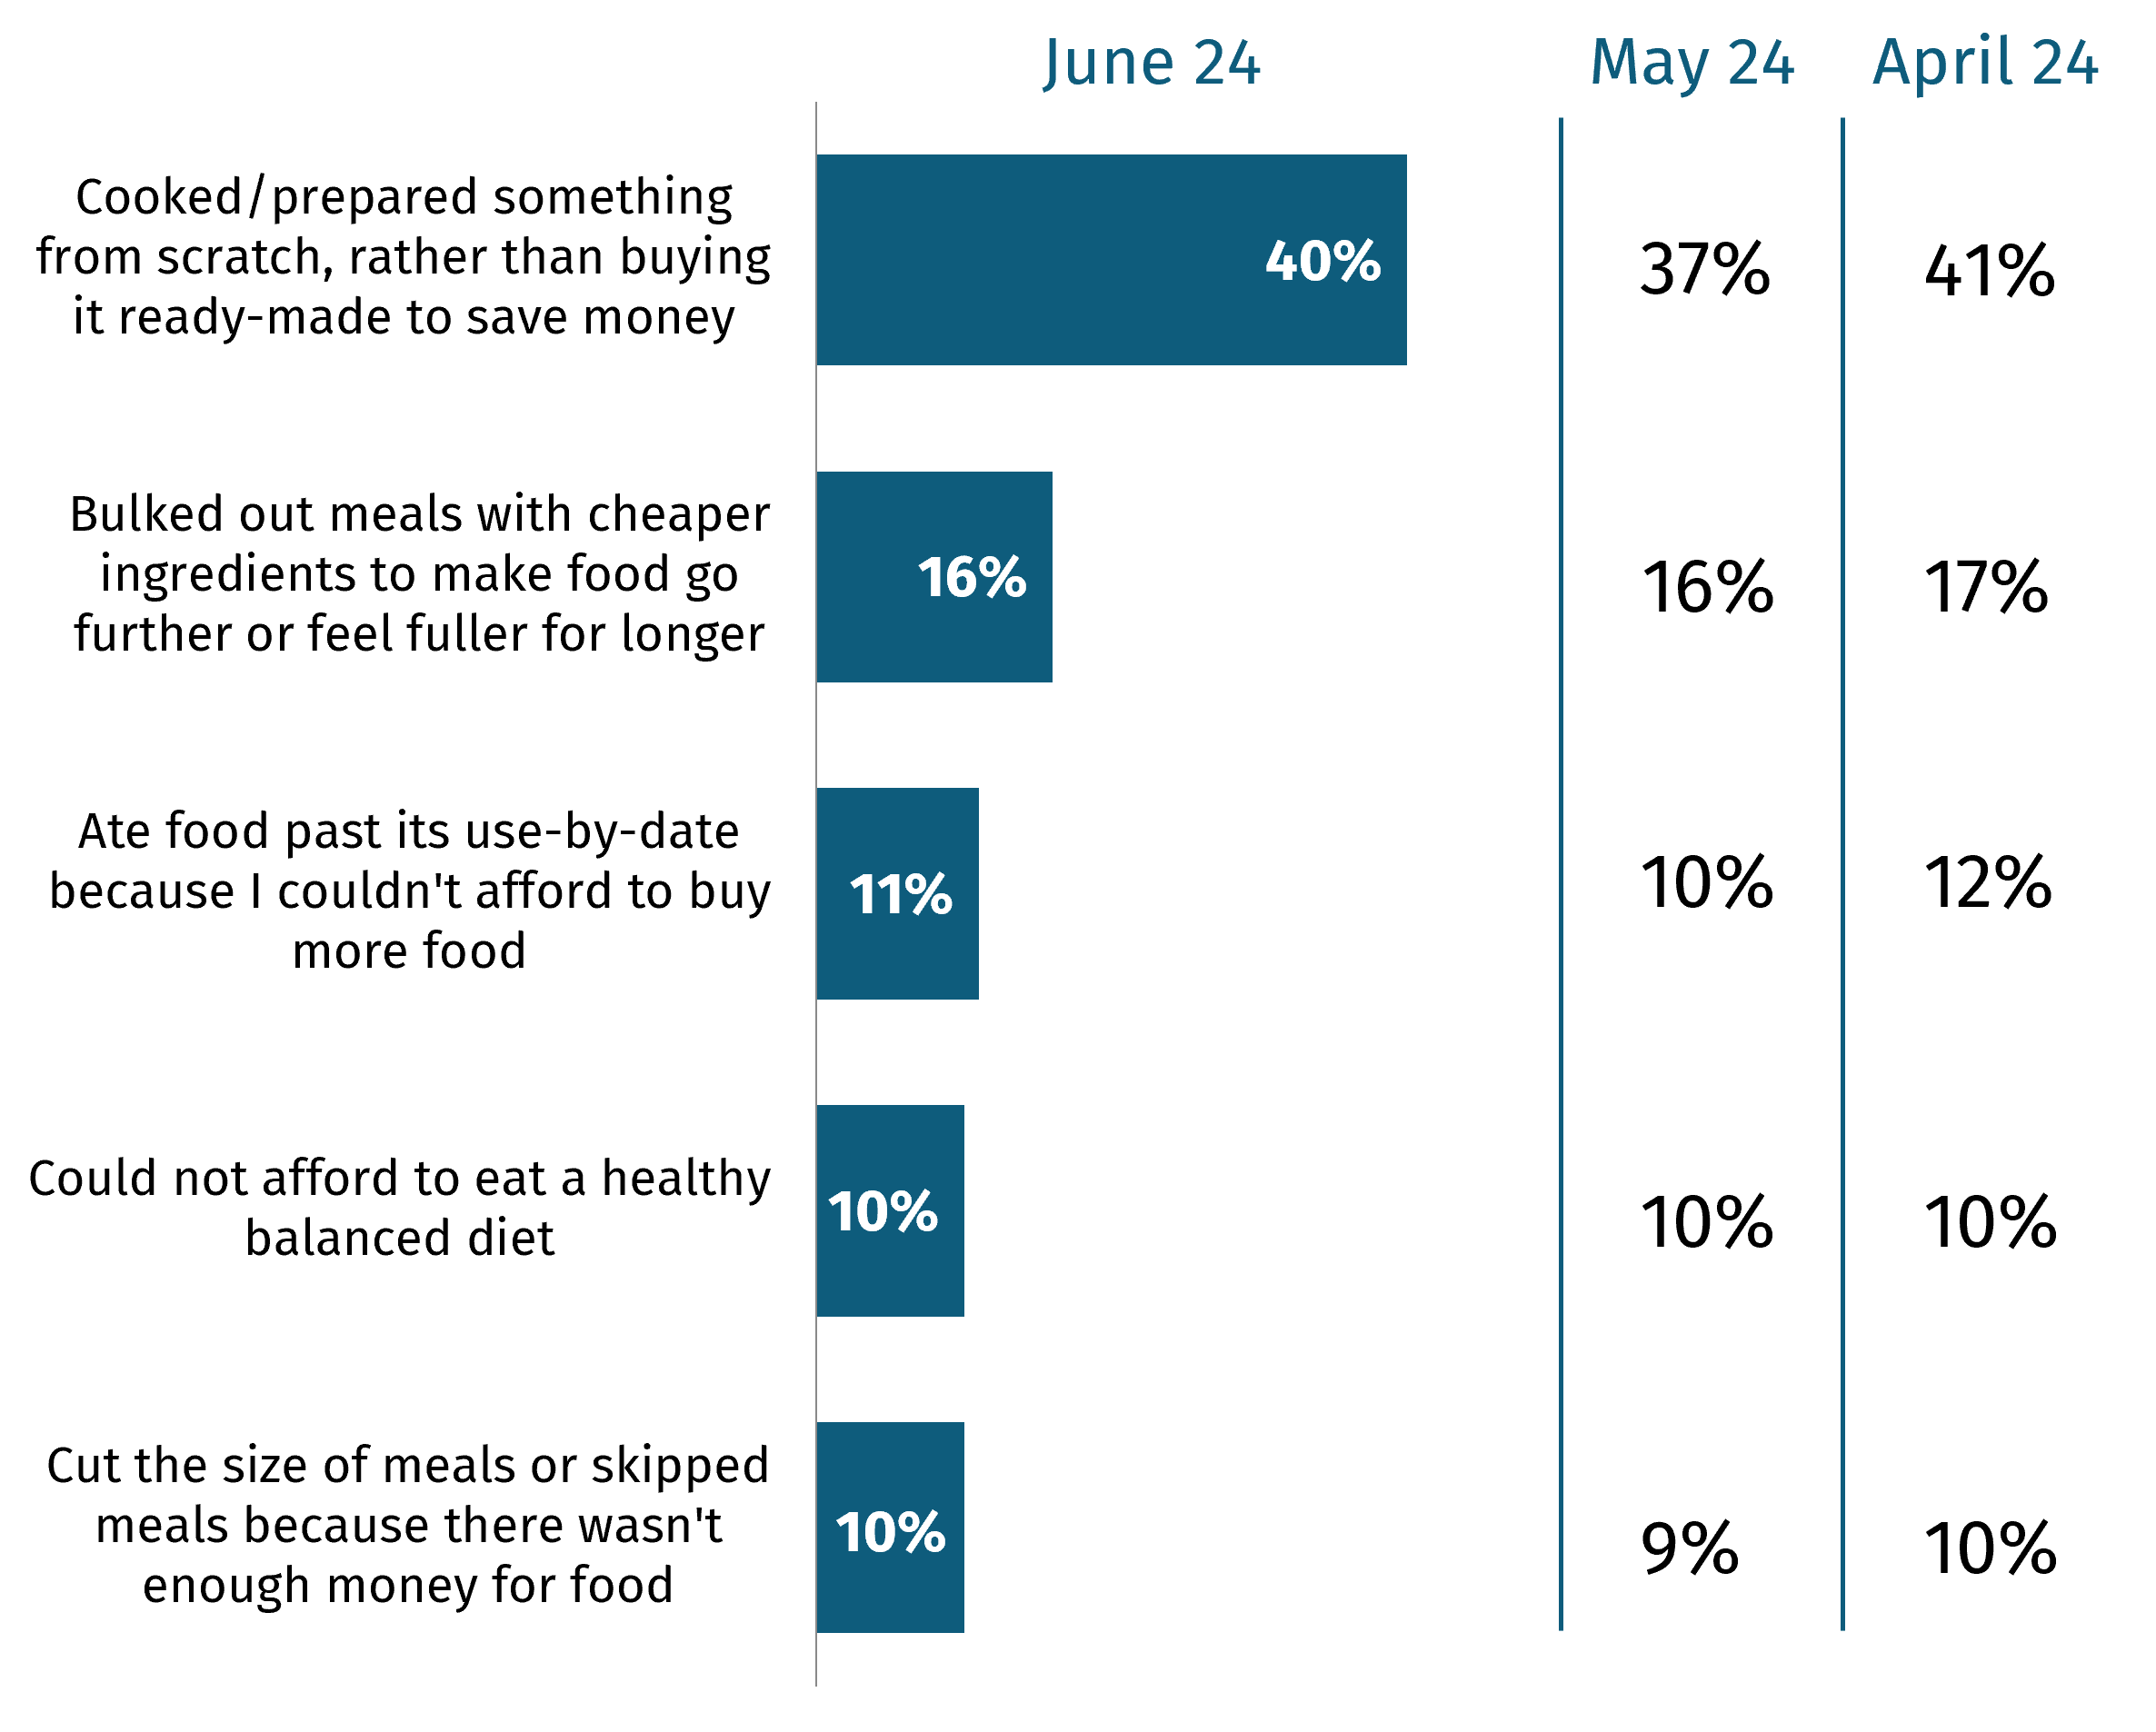
Statistically significant differences compared to May shown with arrows.
Over half report having used cheaper cooking methods instead of an oven to heat or cook food in the last month, which has remained broadly stable over the past three months.
Proportion who did any of the following to reduce energy bills or save money in the last month (footnote 5)
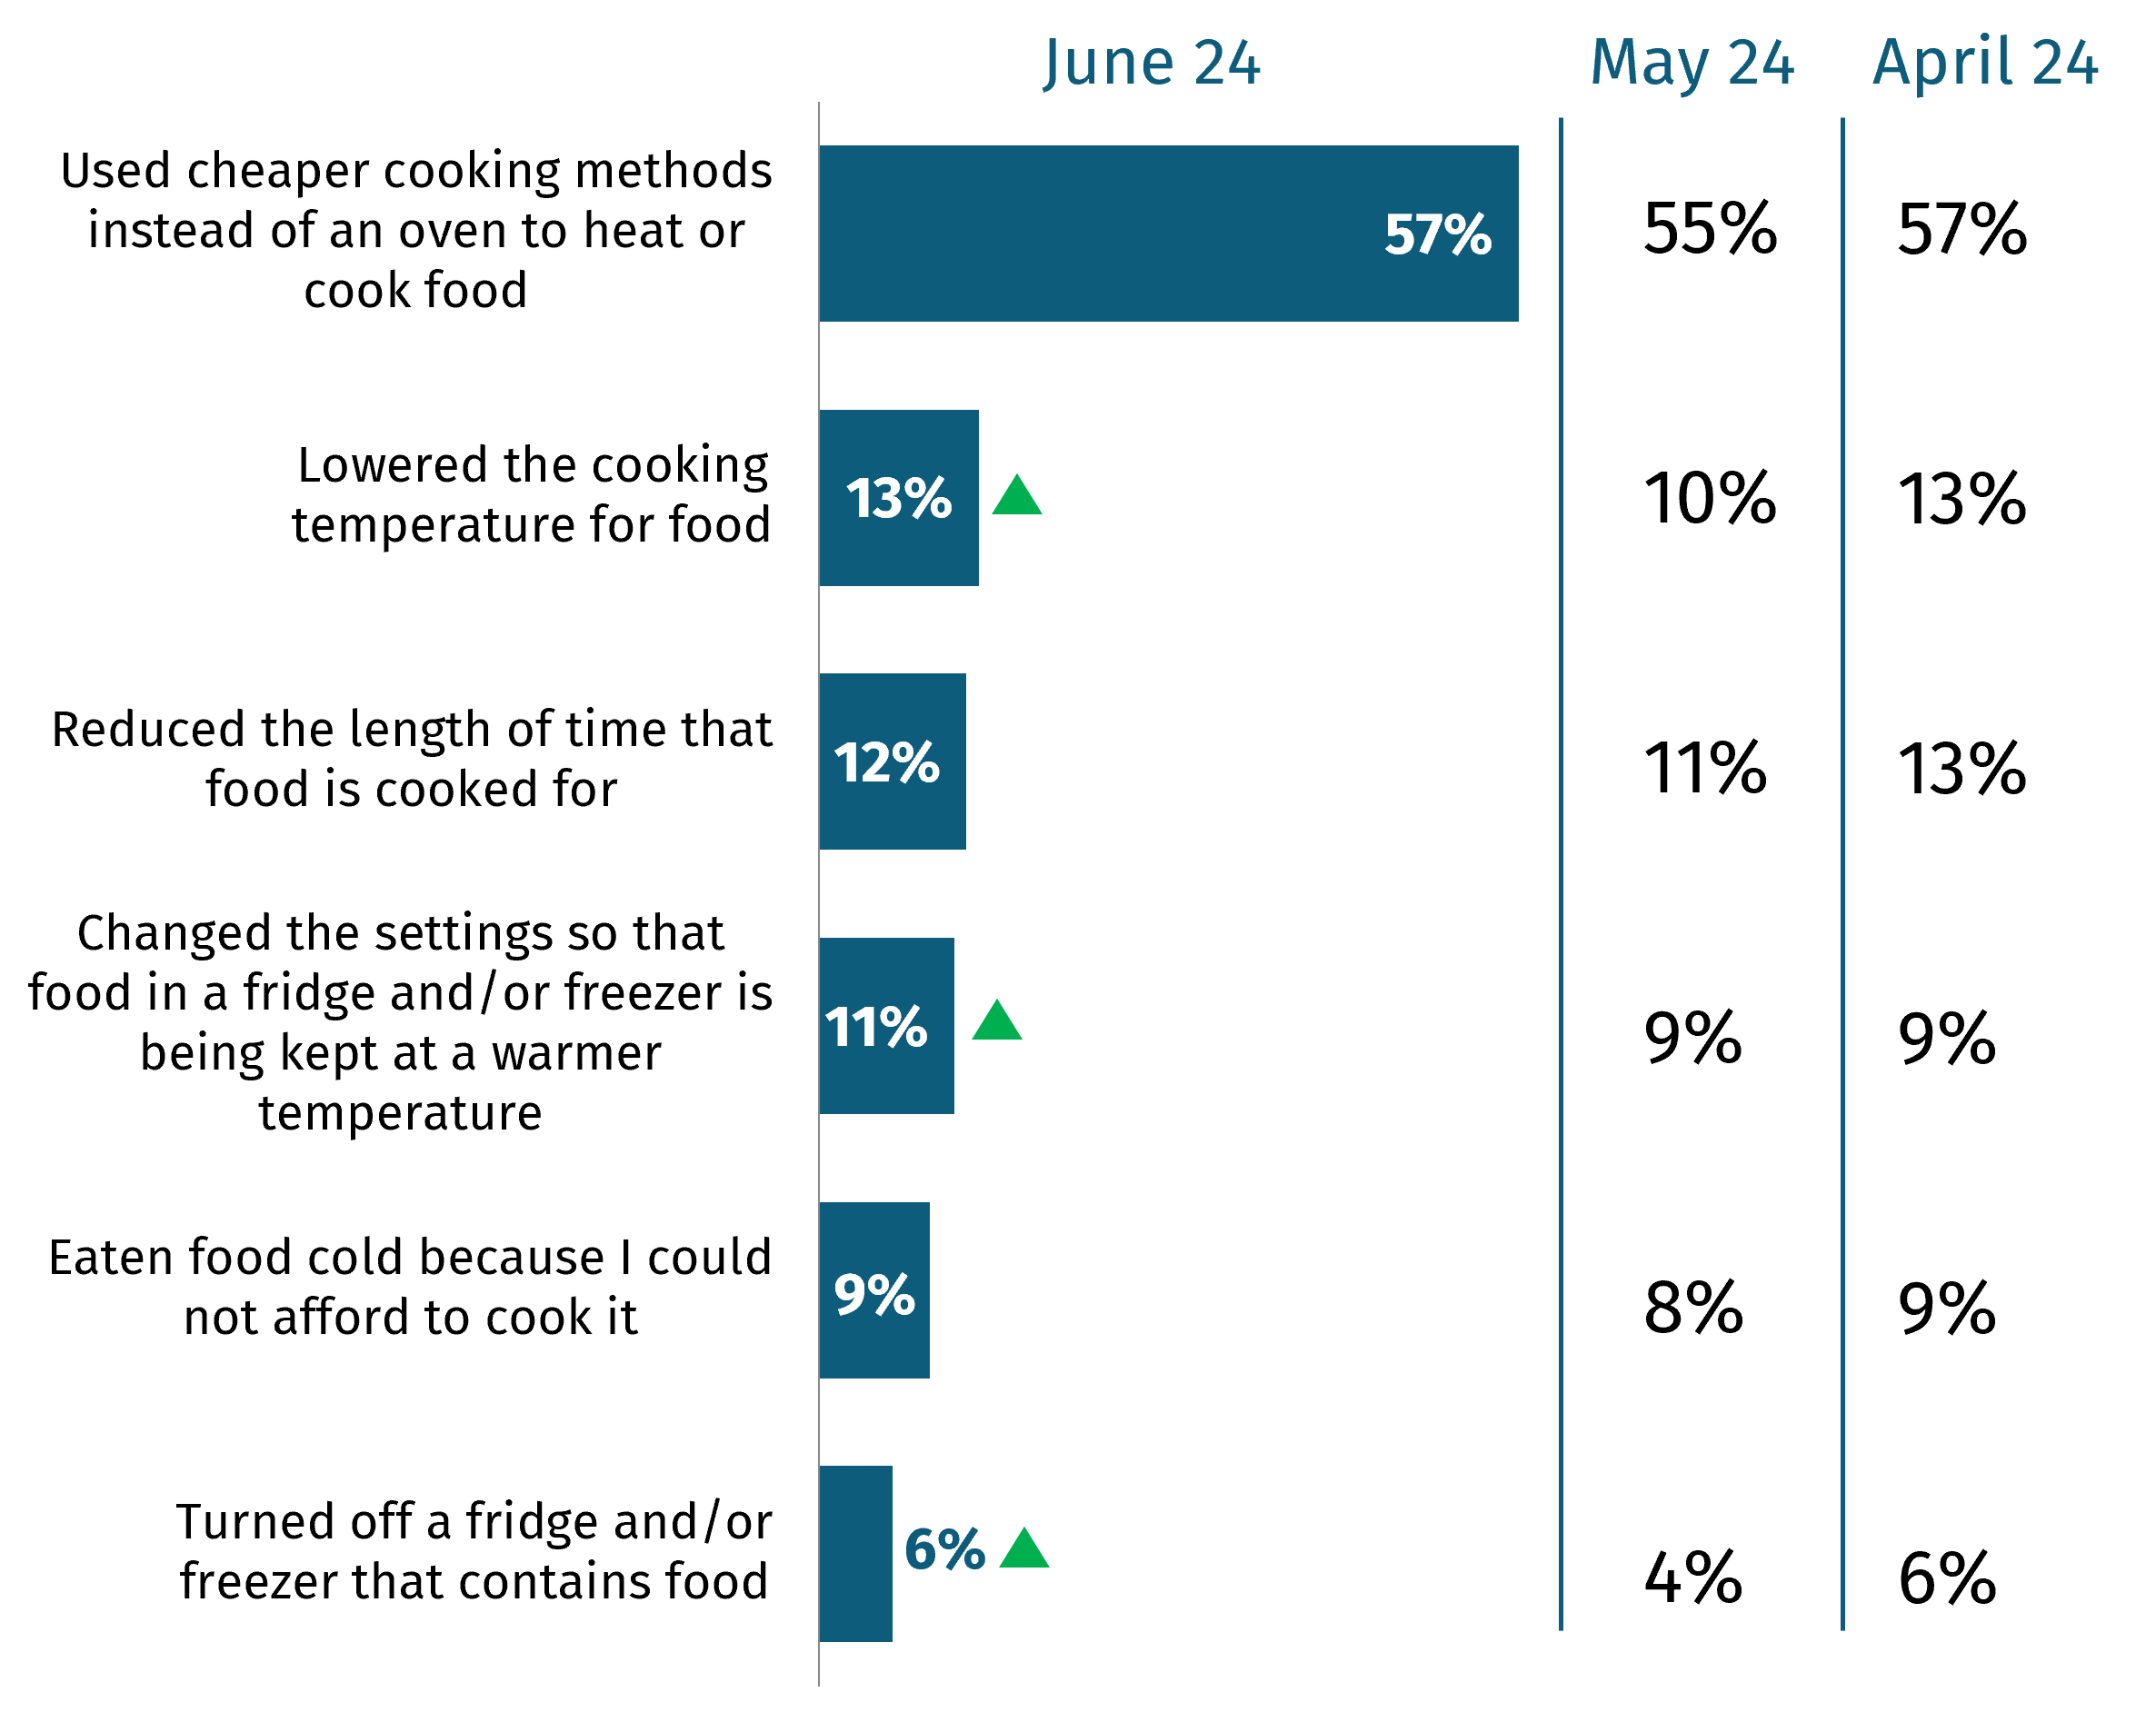
Statistically significant differences compared to May shown with arrows.
Food availability
From April-June 2024, the proportion reporting they are worried about there not being enough food available for their household in the next month remained broadly stable.
In May and June 2024, this figure is around one in five (19%), representing a downwards trend since tracking began. This has remained broadly comparable since January this year.
Proportion who reported worrying about there not being enough food available for their household in the next month (footnote 6)
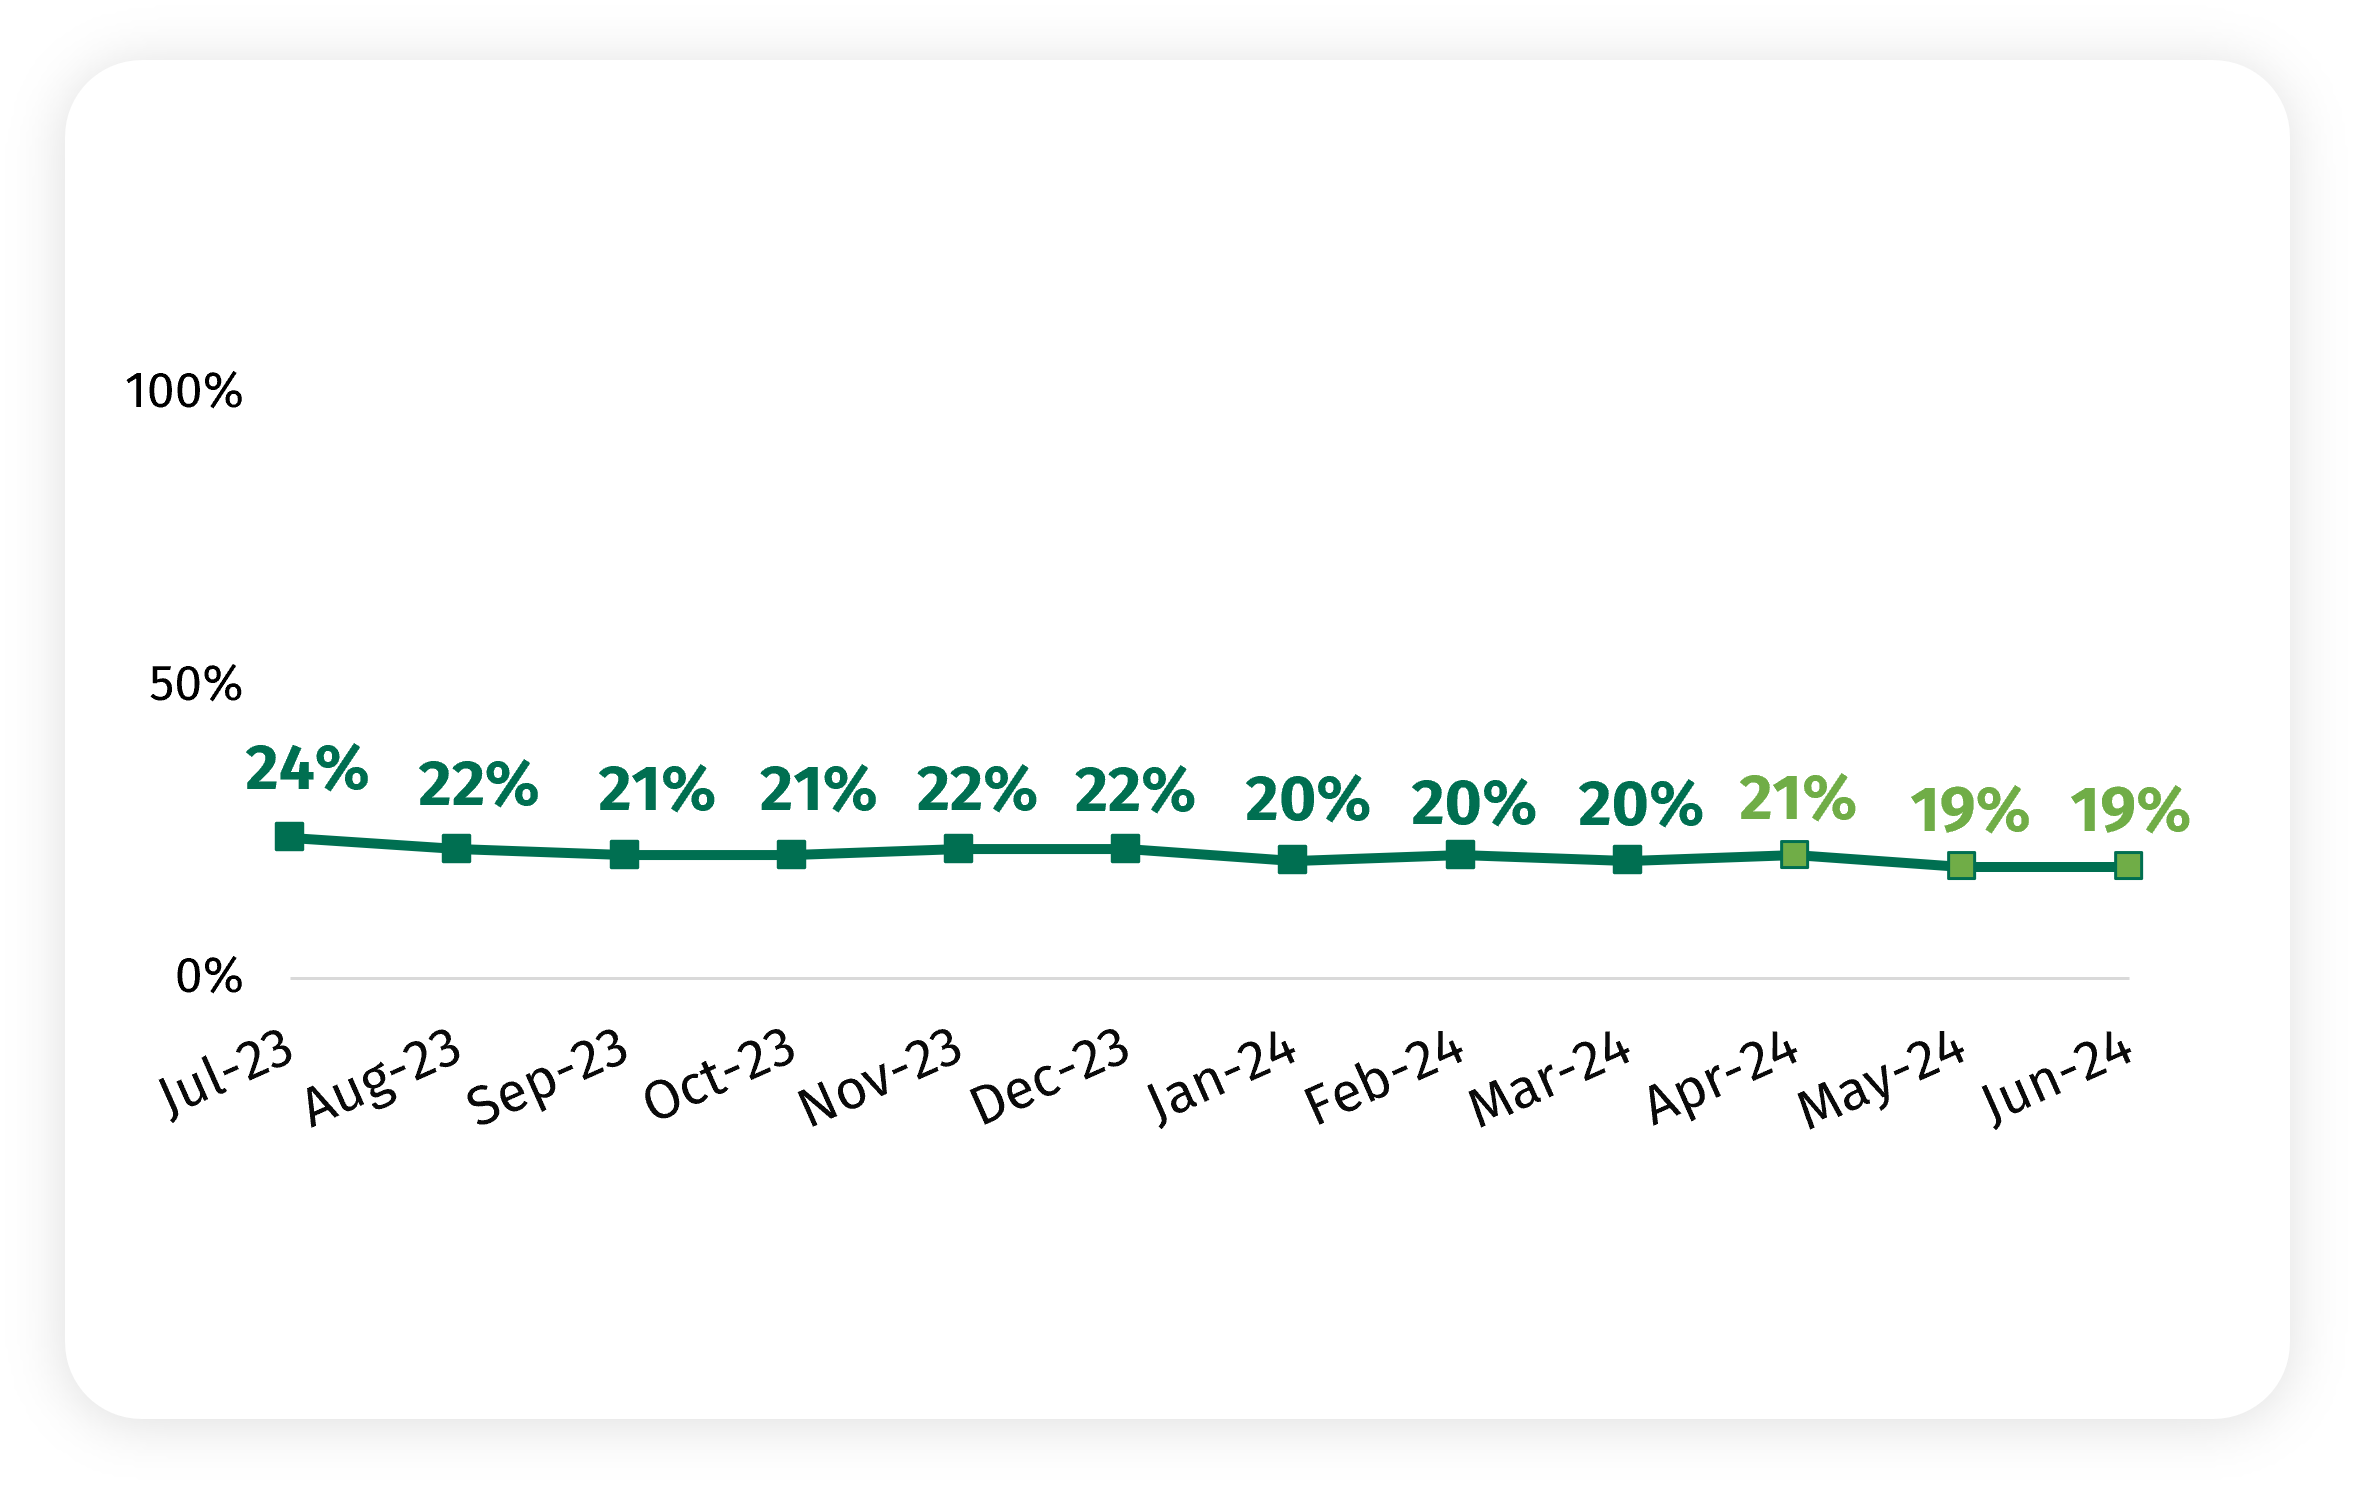
Note: The new data points (from April to June) are shown in a different colour. Statistically significant differences compared to May shown with arrows.
Looking at data from April-June 2024 combined, the following groups are significantly more likely to be worried about there not being enough food available for their household in the next month:
-
Those from minority ethnic backgrounds
-
Those in the younger age groups
-
Most deprived groups (IMD 1-3)
Proportion who reported worrying about there not being enough food available for their household in the next month by demographic group (footnote 7)
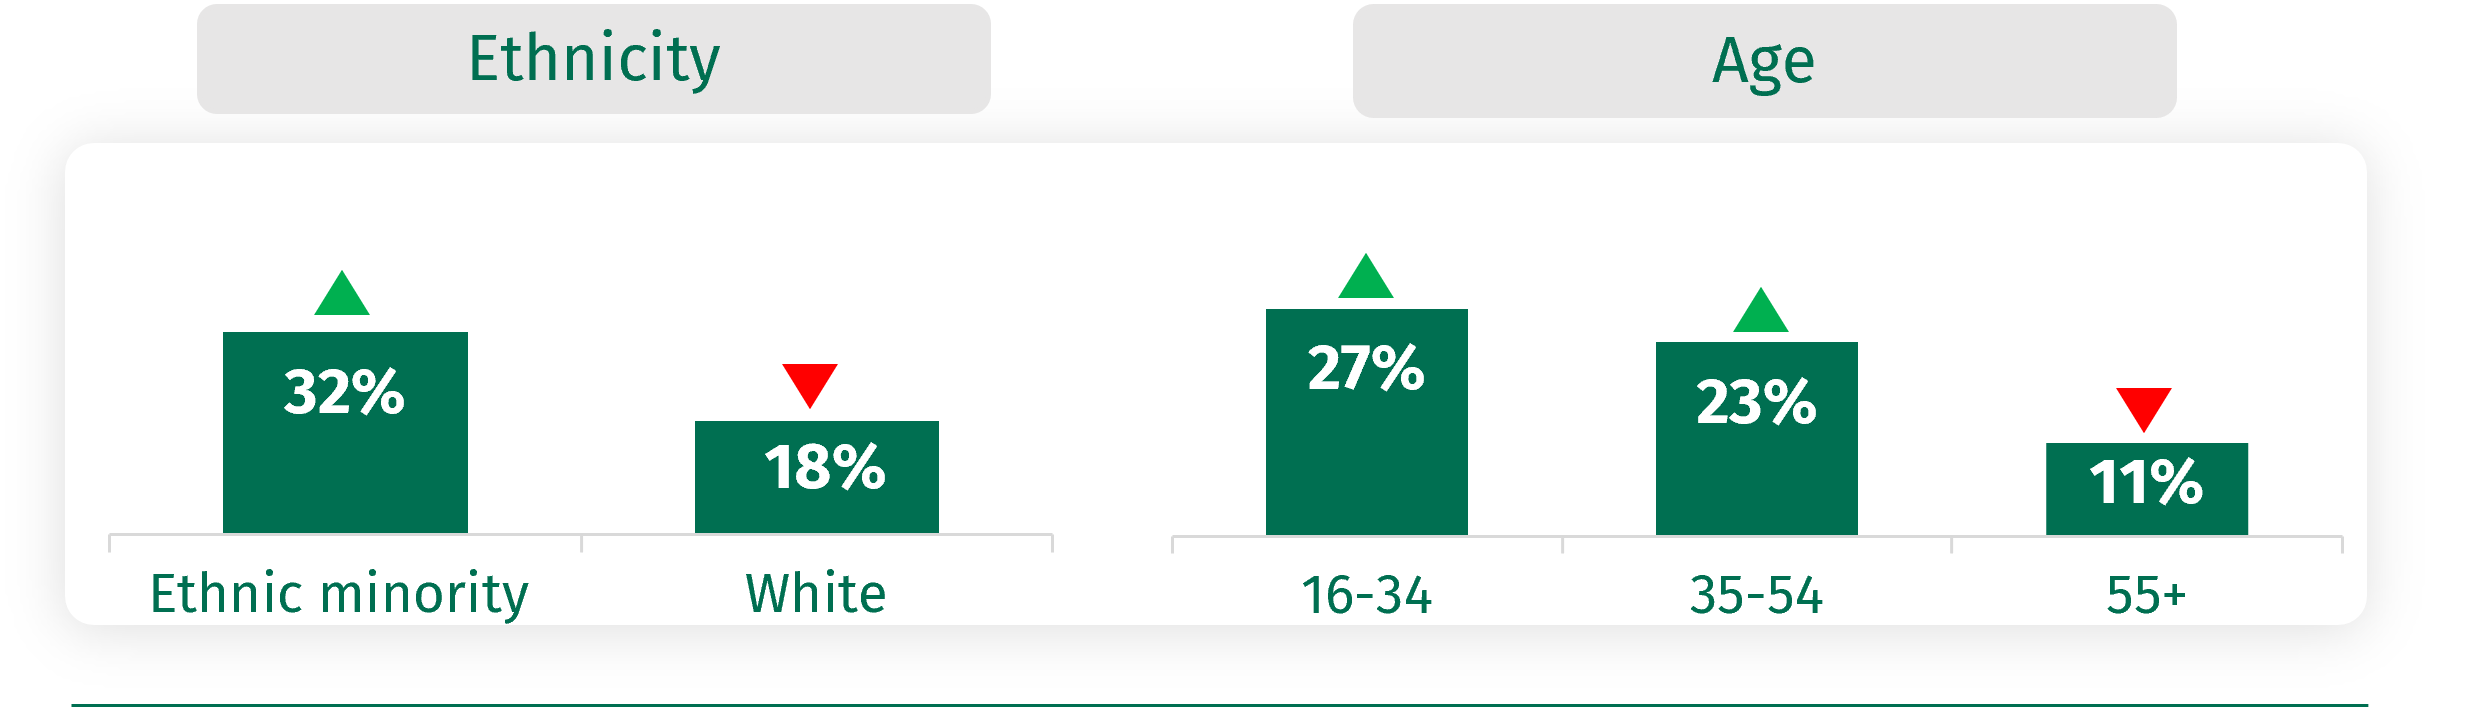
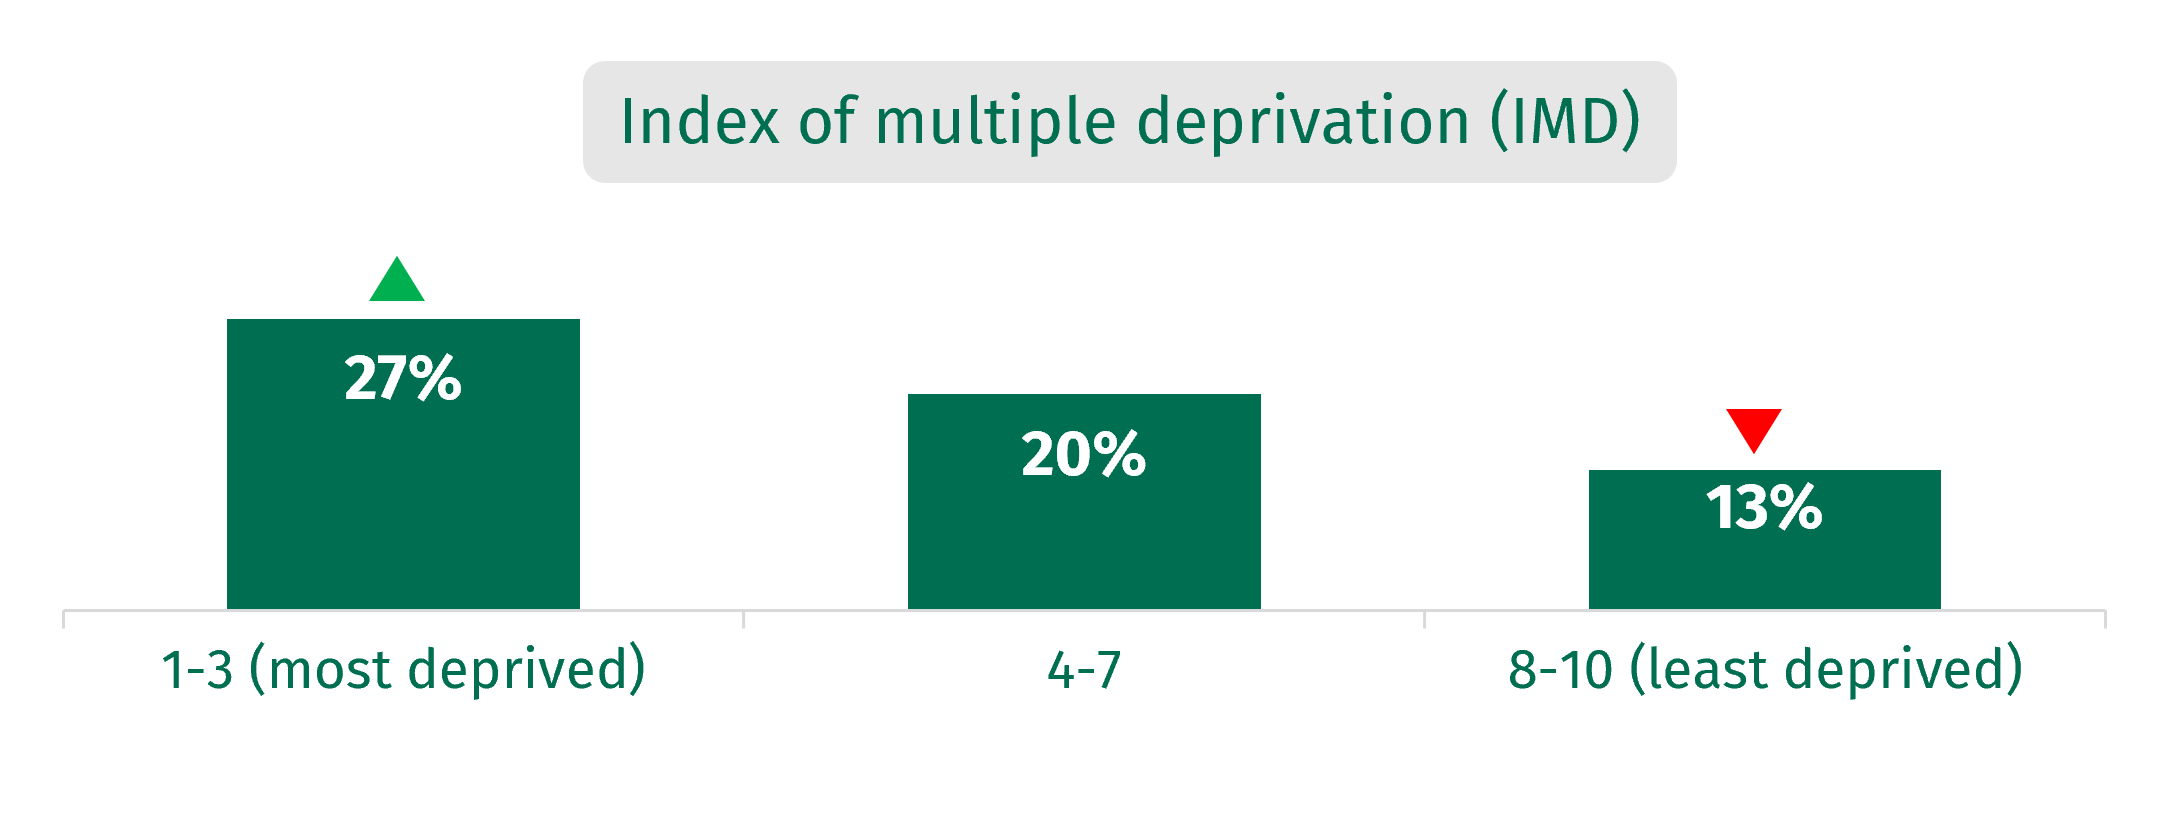
Statistically significant differences against the total shown with arrows.
Food concerns
Food prices, ultra-processed, or over-processing of food and food poverty and inequality remain the top consumer concerns across the period April-June 2024.
Proportion who reported concern about food by topic (footnote 8)
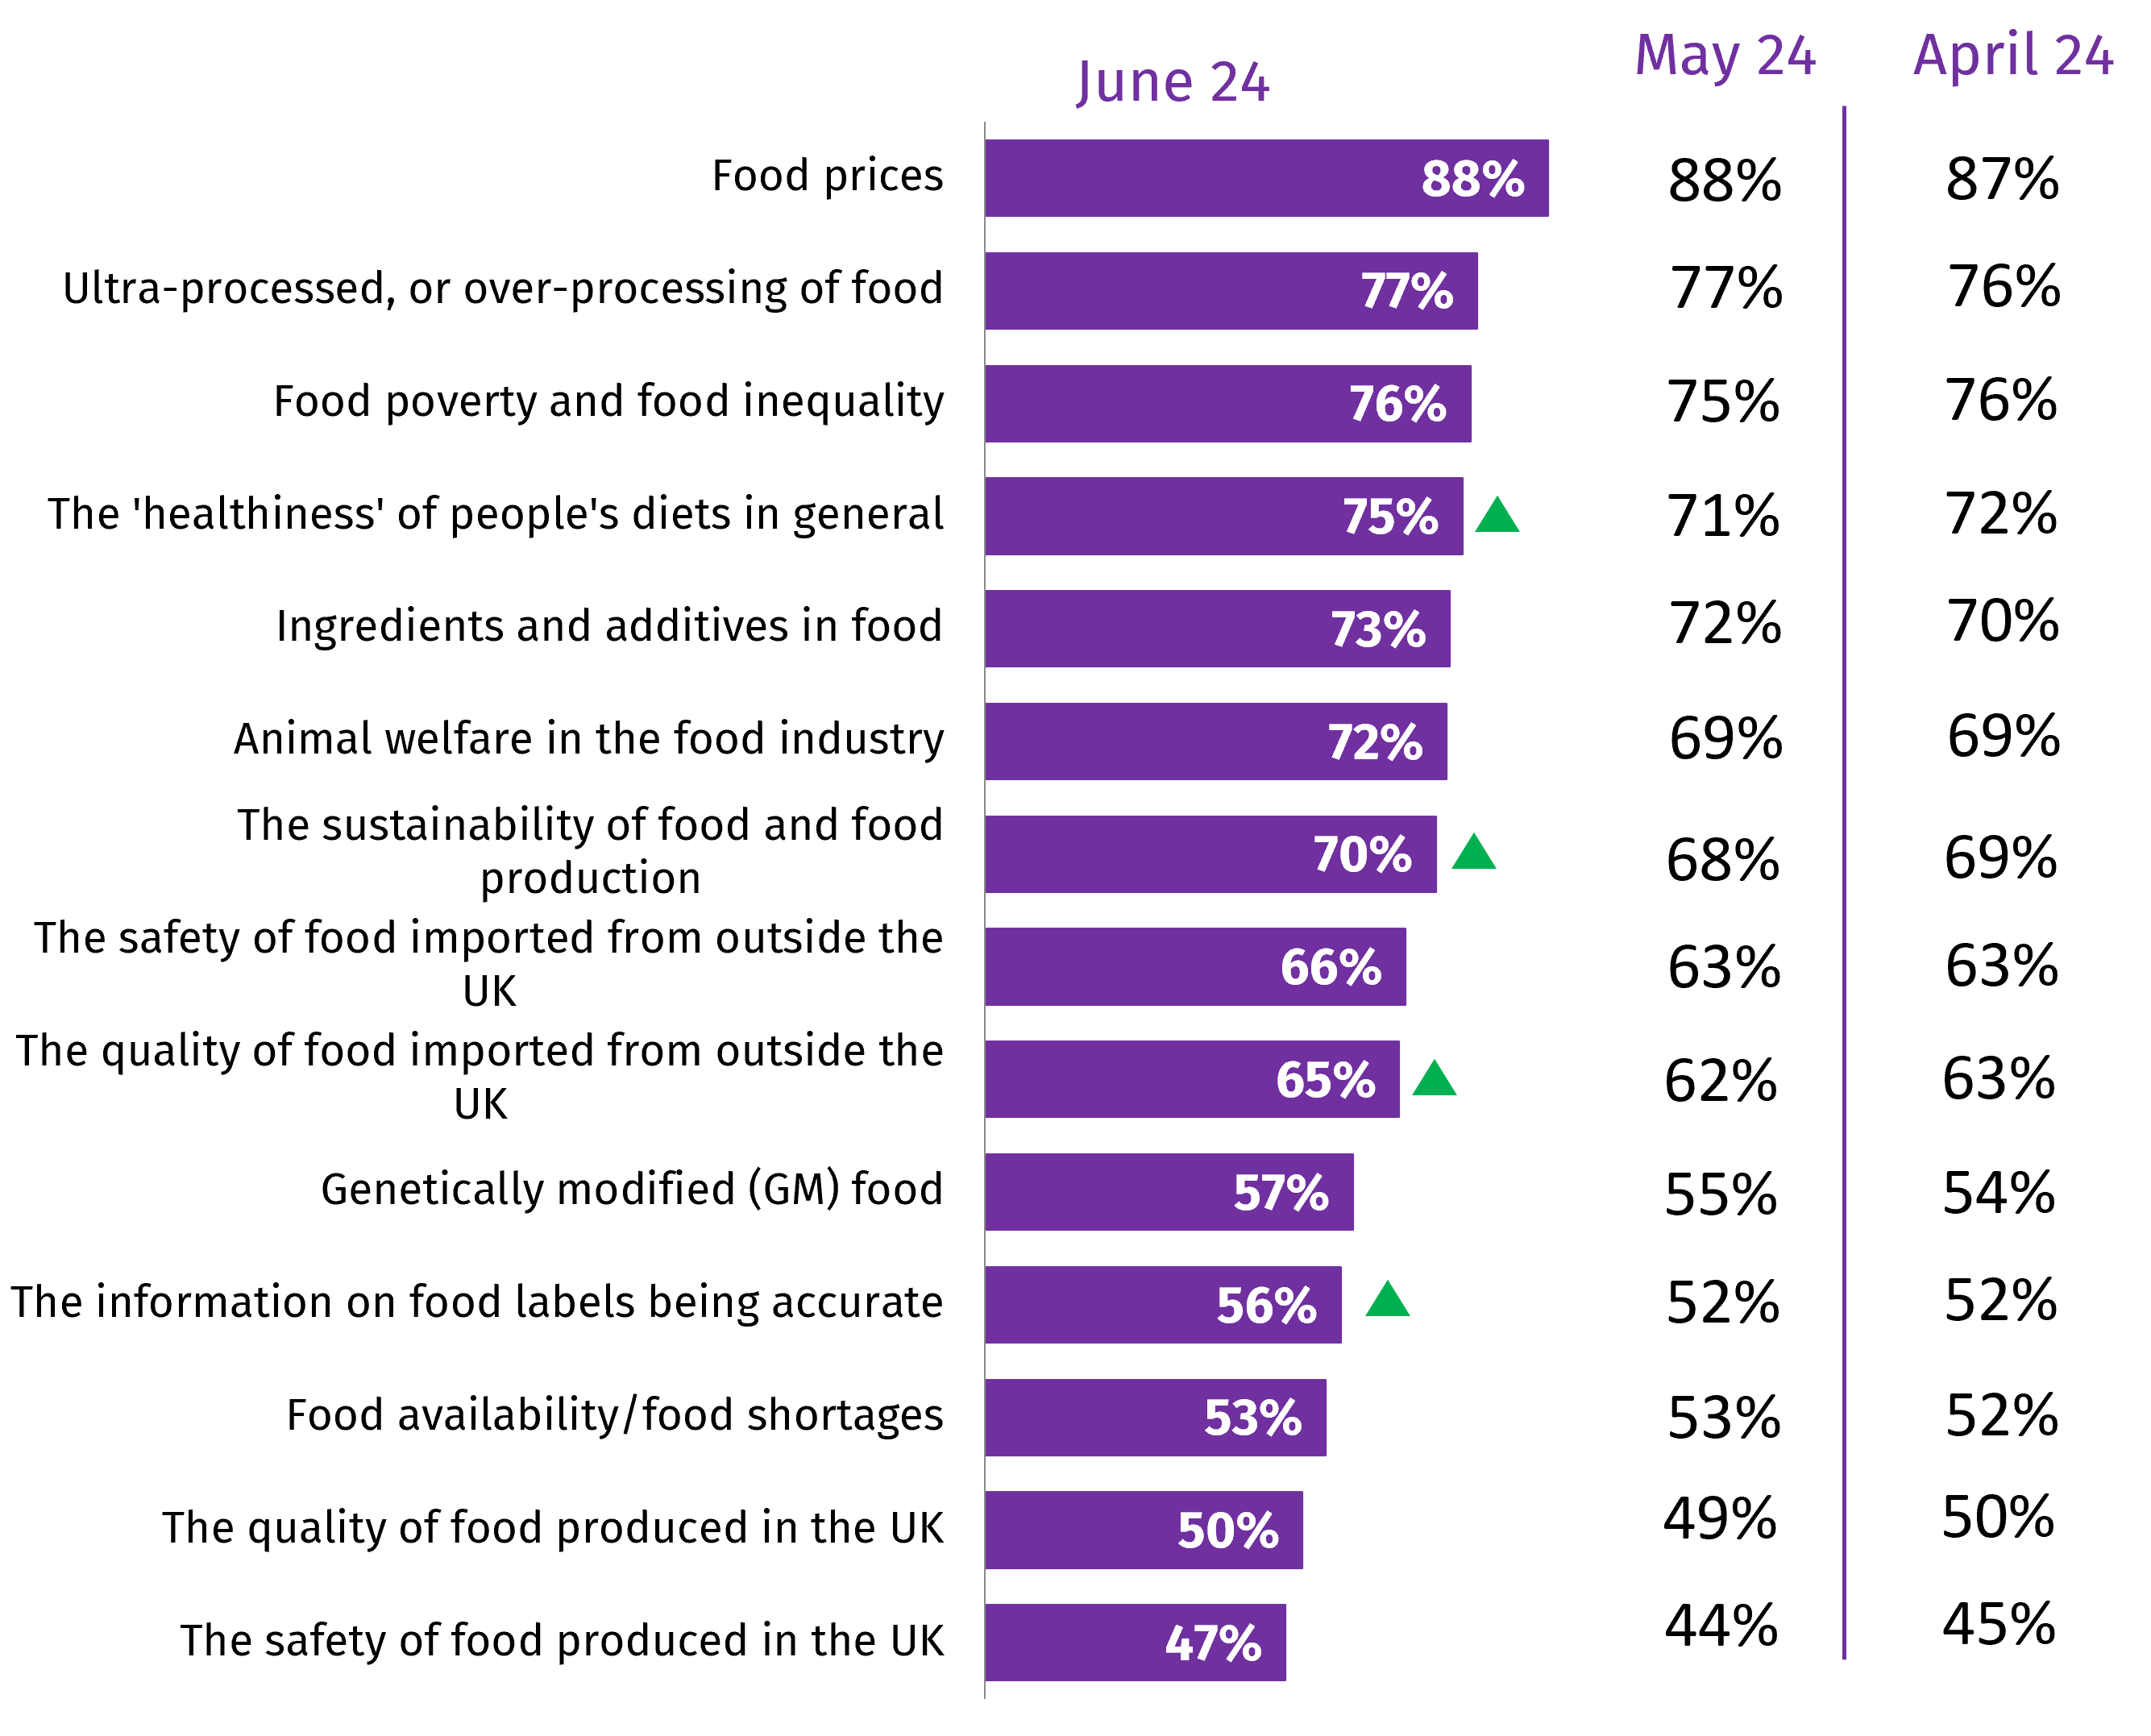
Statistically significant differences compared to May shown with arrows.
Concern about the top 5 issues has remained stable across April-June 2024, with a slight increase in concern about the healthiness of people’s diets from May to June.
Proportion who reported concern about food by topic (footnote 9)
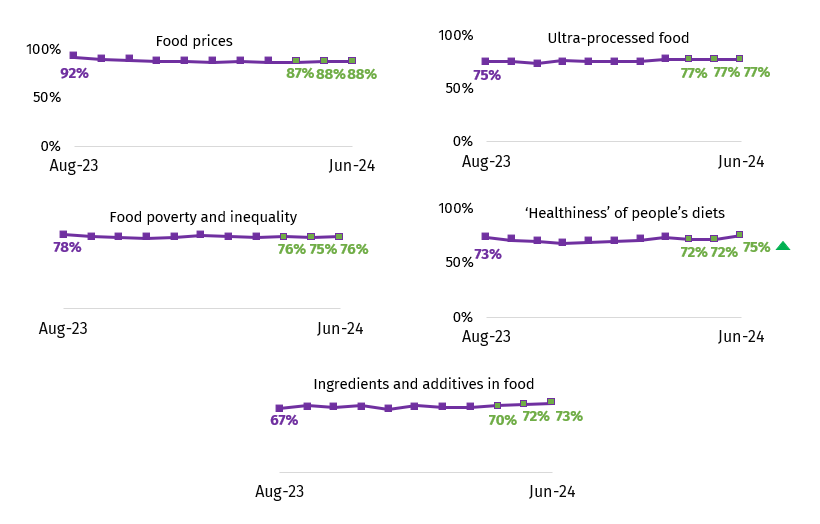
Note: The new data points (from April to June) are shown in a different colour. Statistically significant differences compared to May shown with arrows.
Food supply chain
From April-June 2024, around three in five people report they are confident in the food supply chain.
Respondents are more confident in food safety than food affordability across all months.
Proportion who reported confidence in the food supply chain (footnote 10)
Proportion who reported confidence that those involved in the food supply chain ensure that… (footnote 11)
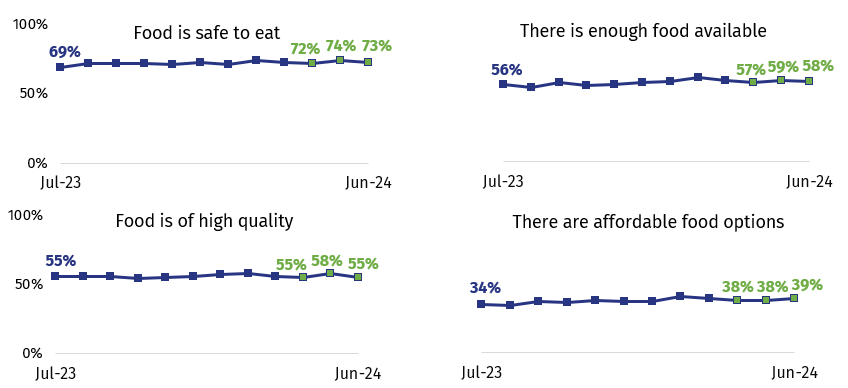
Note: The new data points (from April to June) are shown in a different colour. Statistically significant differences compared to May shown with arrows.
The FSA
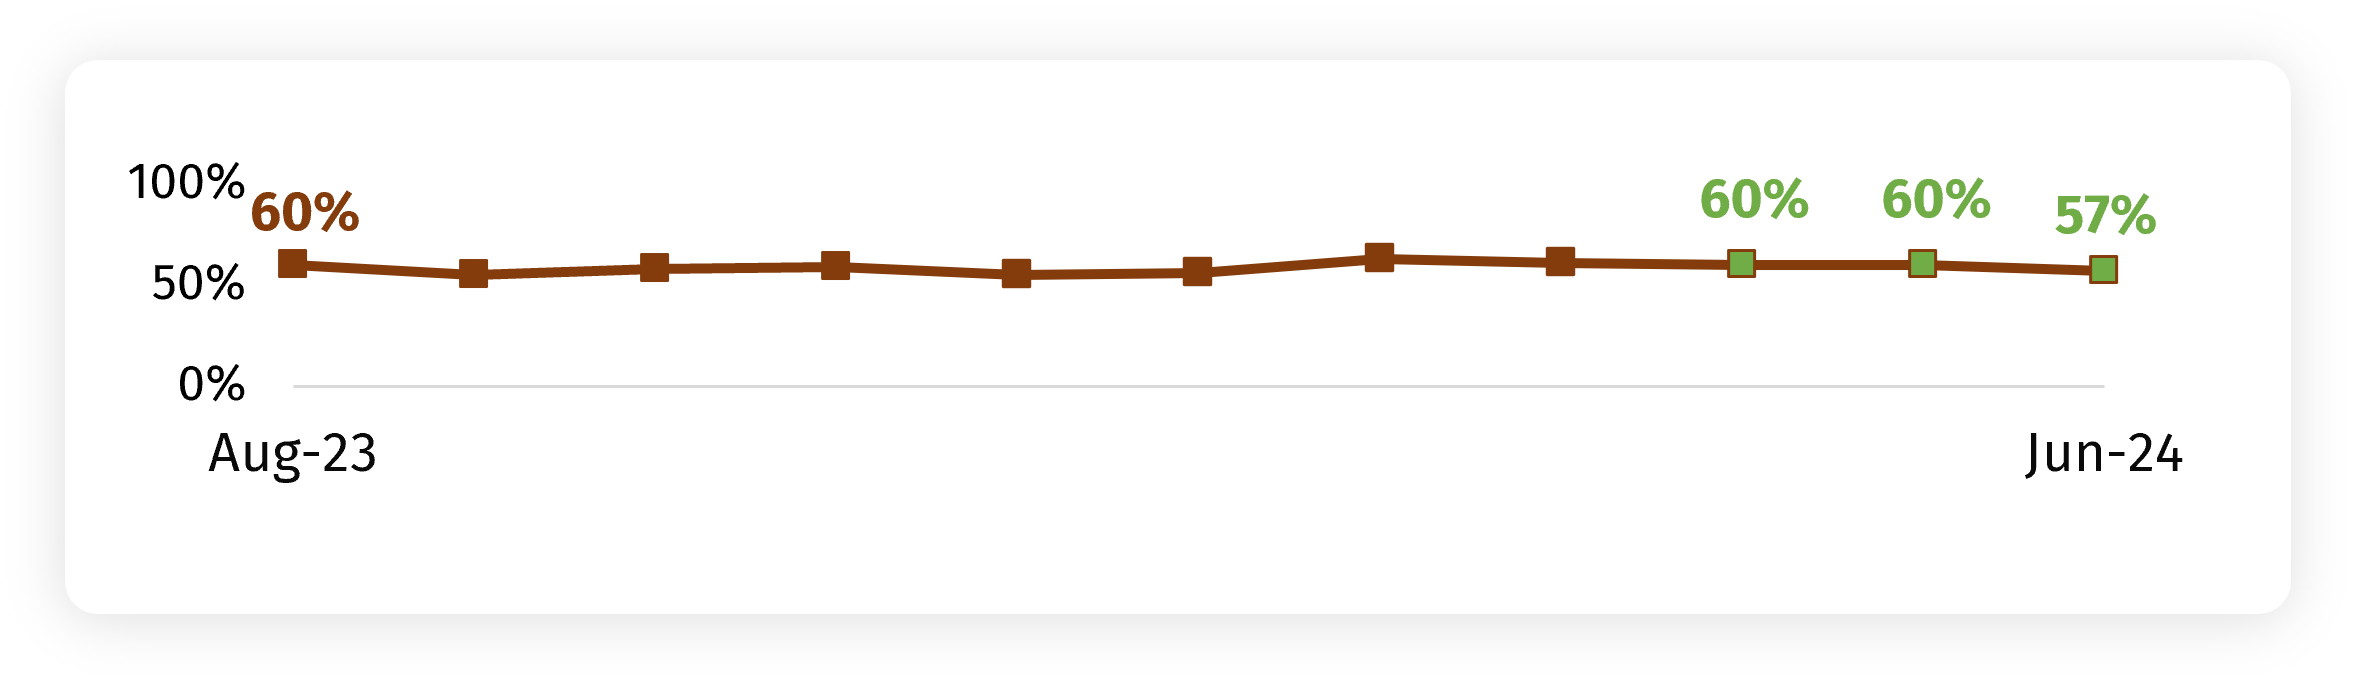
From April-June 2024, around three in five of those with some knowledge of the FSA trust the FSA to do its job.
Trust has fluctuated slightly month to month but remains comparable to when tracking began in August 2023.
Proportion that trust the FSA to do its job (footnote 12)
(among those with knowledge of the FSA)
Proportion who reported confidence that the FSA… (footnote 13)
(among those with knowledge of the FSA)
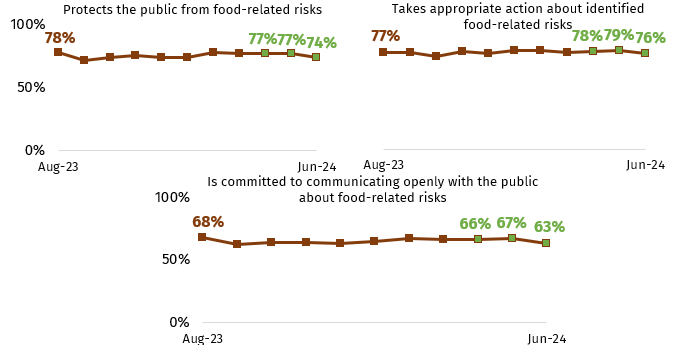
Note: The new data points (from April to June) are shown in a different colour. Statistically significant differences compared to May shown with arrows.
Looking at data from April-June 2024 combined, those who are limited by a long-term health condition or disability report slightly lower levels of confidence in the FSA when thinking about protecting the public from food-related risks and communicating openly about them.
Proportion who reported confidence that the FSA… (footnote 14)
(among those with knowledge of the FSA)


Statistically significant differences compared to the total shown with arrows.
Background and methodological information
Changes in approach
Following a review of the FSA's Consumer Insights Tracker by the FSA’s Advisory Committee for Social Science (ACSS), the project was recommissioned in early 2023.
In July 2023, the Consumer Insights Tracker was transitioned to a new supplier, YouGov. Changing supplier provided the opportunity to make the following methodological changes:
- review the questionnaire content and question wording
- expand the sample to include adults aged 16+ (previously 16-75)
- boost the sample to include a larger number of participants from Northern Ireland
- utilise a panel survey approach (previously an omnibus approach was used to collect the data)
Due to these methodological differences, data captured by YouGov (from July 2023 onwards) should not be directly compared to data captured by the previous supplier (April 2020 – June 2023).
Method
- this research was conducted online using the YouGov panel which gives access to 400,000 active panellists in the UK.
- this report presents findings from the months April-June 2024. Where appropriate, comparisons are made to previous waves since July 2023.
- for demographic analysis, data for the last quarter has been combined to give larger base sizes.
- across England, Wales and Northern Ireland 2,061 took part in the survey in April 2024 (5th-9th), 2,067 in May 2024 (3rd-7th) and 2,056 in June 2024 (May 31st-June 4th).
- quotas were set by age, gender, education and region. The data is also weighted to be representative of the population by these demographic variables. All results are based on final weighted data.
Notes for interpretation
- figures may not add up to 100% on graphs due to rounding, or in some questions, respondents were able to select multiple answers.
- significance testing is applied to the data to compare and determine whether a difference is “real”, or if it has occurred by chance (because not everyone in the population has been surveyed).
- any differences between demographic groups and month to month which are reported (with arrows) are statistically significant at the 95% confidence level.
- where analysis is conducted by IMD, respondents are categorised within the country where they live, before a combined measure is created for the full sample.
- further information on the statistical significance testing can be found in the technical report.
For more information
-
visit our Consumer Insights Tracker webpage
- or please contact the FSA Social Science Team
-
Q3m. To what extent, if at all, are you worried you/your household will not be able to afford food in the next month? Base: All in June 2024 (n=2,056), May (n=2,067), April (n=2,061), March (n=2,015), February (n=2,066), January (n=2,038), December (n=2,026), November (n=2,064), October (n=2,062), September (n=2,057), August (n=2,044) and July 2023 (n=2,085).
-
Q3. In the last month, have you or anyone else in your household received a free parcel of food from a food bank or other emergency food provider? Base: All in June 2024 (n=2,056), May (n=2,067), April (n=2,061), March (n=2,015), February (n=2,066), January (n=2,038), December (n=2,026), November (n=2,064), October (n=2,062), September (n=2,057) and August 2023 (n=2,044).
-
Q6. In the last month, did any of the following apply to you, or someone else in your household? Please tick all that apply. I, or someone in my household... Base: All in June 2024 (n=2,056), May (n=2,067), April (n=2,061), March (n=2,015), February (n=2,066), January (n=2,038), December (n=2,026), November (n=2,064), October (n=2,062), September (n=2,057) and August 2023 (n=2,044). Please note: Total values do not add to 100% as participants could select multiple responses.
-
Q6. In the last month, did any of the following apply to you, or someone else in your household? Please tick all that apply. I, or someone in my household... Base: All in June 2024 (n=2,056), May (n=2,067) and April 2024 (n=2,061).
-
Q8m. In the last month, which, if any, of the following have you done to reduce your energy bills and save money? Base: All in June 2024 (n=2,056), May (n=2,067) and April 2024 (n=2,061).
-
Q2m. To what extent, if at all, are you worried about there not being enough food available for you/your household to buy in the next month? Base: All June 2024 (n=2,056), May (n=2,067), April (n=2,061), March (n=2,015), February (n=2,066), January (n=2,038), December (n=2,026), November (n=2,064), October (n=2,062), September (n=2,057), August (n=2,044) and July 2023 (n=2,085).
-
Q2m. To what extent, if at all, are you worried about there not being enough food available for you/your household to buy in the next month? Base: All in April-June 2024 (n=6,184). For demographic analysis, data for the last quarter has been rolled up to give larger base sizes. The Index of Multiple Deprivation (IMD) is a measure of deprivation calculated based off postcode, which takes into account income, employment, education, skills and training, health, crime, housing and the living environment of an area.
-
Q12. Thinking about food in the UK in general. At the moment, how concerned, if at all, do you feel about each of the following topics? Base: All June 2024 (n=2,056), May (n=2,067) and April 2024 (n=2,061). Respondents were shown all of the topics listed and asked how concerned, if at all, they felt about each. Figures shown in chart are the proportion ‘highly concerned’ or ‘somewhat concerned’.
-
Q12. Thinking about food in the UK in general. At the moment, how concerned, if at all, do you feel about each of the following topics? (Top 5 concerns shown). Base: All June 2024 (n=2,056), May (n=2,067), April (n=2,061), March (n=2,015), February (n=2,066), January (n=2,038), December (n=2,026), November (n=2,064), October (n=2,062), September (n=2,057) and August 2023 (n=2,044). Respondents were shown all of the topics listed and asked how concerned, if at all, they felt about each. Figures shown in chart are the proportion ‘highly concerned’ or ‘somewhat concerned’.
-
Q13. How confident are you in the food supply chain? That is all the processes involved in bringing food to your table. Base: All June 2024 (n=2,056), May (n=2,067), April (n=2,061), March (n=2,015), February (n=2,066), January (n=2,038), December (n=2,026), November (n=2,064), October (n=2,062), September (n=2,057), August (n=2,044) and July 2023 (n=2,085).
-
Q14. How confident are you that those involved in the food supply chain in the UK… Base: All June 2024 (n=2,056), May (n=2,067), April (n=2,061), March (n=2,015), February (n=2,066), January (n=2,038), December (n=2,026), November (n=2,064), October (n=2,062), September (n=2,057), August (n=2,044) and July 2023 (n=2,085).
-
Q16. The Food Standards Agency is the Government Agency responsible for food safety in England, Wales and Northern Ireland. How much do you trust or distrust the Food Standards Agency to do its job? That is to make sure that food is safe and what it says it is. Base: Those who know a little / a lot about the Food Standards Agency in June 2024 (n=1,163), May (n=1,161), April (n=1,137), March (n=1,137), February (n=1,127) January (n=1,168) December (n=1,134), November (n=1,183), October (n=1,175), September (n=1,161) and August 2023 (n=1,126).
-
Q15. The Food Standards Agency is the Government Agency responsible for food safety in England, Wales and Northern Ireland. How confident are you that the Food Standards Agency... Base: Those who know a little / a lot about the Food Standards Agency in June 2024 (n=1,163), May (n=1,161), April (n=1,137), March (n=1,137), February (n=1,127) January (n=1,168) December (n=1,134), November (n=1,183), October (n=1,175), September (n=1,161) and August 2023 (n=1,126).
-
Q15. The Food Standards Agency is the Government Agency responsible for food safety in England, Wales and Northern Ireland. How confident are you that the Food Standards Agency... Base: All who report being limited a lot/a little by a long-term health condition or disability (n=1,036) and those who are not (n=2,393) in the period April-June 2024. For demographic analysis, data for the last quarter has been combined to give larger base sizes. Long-term health condition or disability: Are your day-to-day activities limited because of a health problem or disability which has lasted, or is expected to last, at least 12 months?
Hanes diwygio
Published: 29 Gorffennaf 2024
Diweddarwyd ddiwethaf: 29 Gorffennaf 2024