Research project
Consumer Insights Tracker Report July 2023 - March 2024
The Consumer Insights Tracker is the Food Standards Agency’s monthly tracking survey that monitors changes in consumers’ behaviour and attitudes in relation to food. This end of year report presents insights from July 2023 to March 2024.
Executive summary
The Consumer Insights Tracker is the FSA’s online monthly tracking survey. It monitors the behaviour and attitudes of consumers aged 16+ in England, Wales, and Northern Ireland in relation to a range of food-related topics.
This report presents findings from July 2023 – March 2024. Key findings show that:
Consumer concerns about food
- When prompted with a number of different issues related to food in the UK, the issue the highest number of consumers were concerned about was food prices (87% in March 2024), followed by ultra-processed, or the over-processing, of food (77%) and food poverty and inequality (75%). Concerns about food-related issues have stayed relatively stable since July 2023 when tracking began.
Household food affordability
- The proportion saying that they were worried (footnote 1) about their household’s ability to afford food in the next month has declined gradually across the tracking period, falling from a peak of 28% in July 2023 to a low of 22% in February and March 2024.
- Worries about food affordability were highest among those limited by a disability or long-term health condition, those aged under 55, those in the most deprived IMD deciles, those from ethnic minority backgrounds and those living in Northern Ireland.
- Large proportions said that they had taken action when shopping, cooking and eating in order to save money. In March 2024, the most common ways of saving money when shopping were choosing cheaper alternatives to branded products (47%), buying discounted food close to its use-by date (37%) and shopping around in multiple supermarkets/ shops (34%).
- Overall, in March 2024 one in four (25%) of those in England, Wales and Northern Ireland said they had done at least one ‘risky’ food behaviour in the last month to save money, such as reducing the length of time food is cooked for or turning off a fridge/freezer that contains food.
- Those who were worried about food affordability (58%) were significantly more likely to report practicing these kinds of risky behaviours. Incidence of risky food behaviours was also higher among those from an ethnic minority background (39%), those limited by a health condition or disability (35%), those in the most deprived IMD deciles (33%) and those aged under 35 (30%).
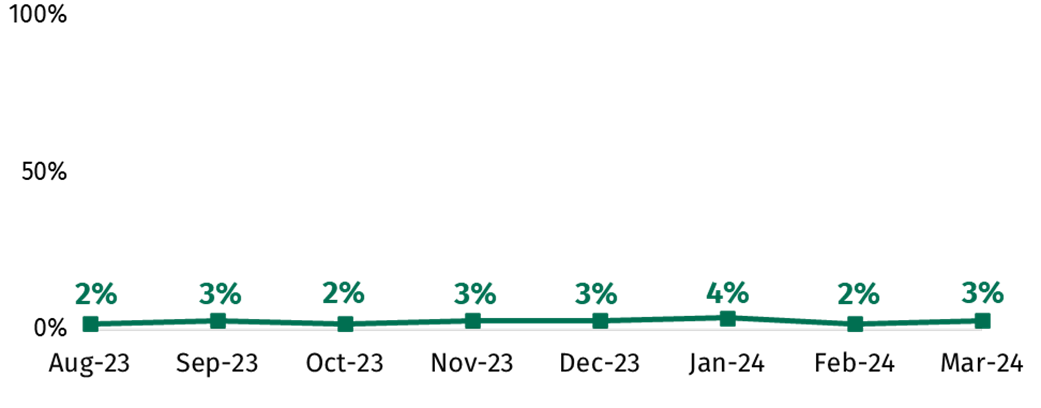
- The proportion who reported that they or someone in their household had received a free parcel of food from a food bank or emergency food provider has remained stable across the 9-month tracking period, with the reported figure ranging from 2-4%.
Food availability
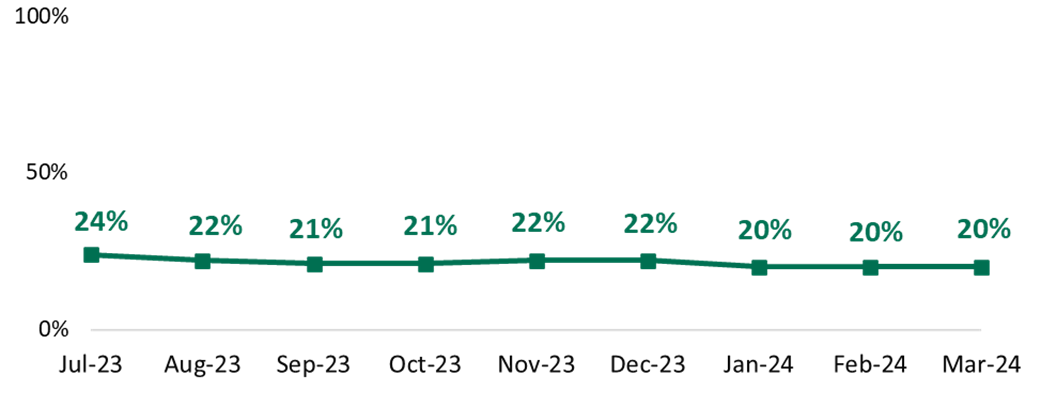
- One in five (20%) said that they were worried about there not being enough food available for them (or their household) to buy in the next month. Worry about food availability has remained broadly comparable over time.
Confidence in the food supply chain
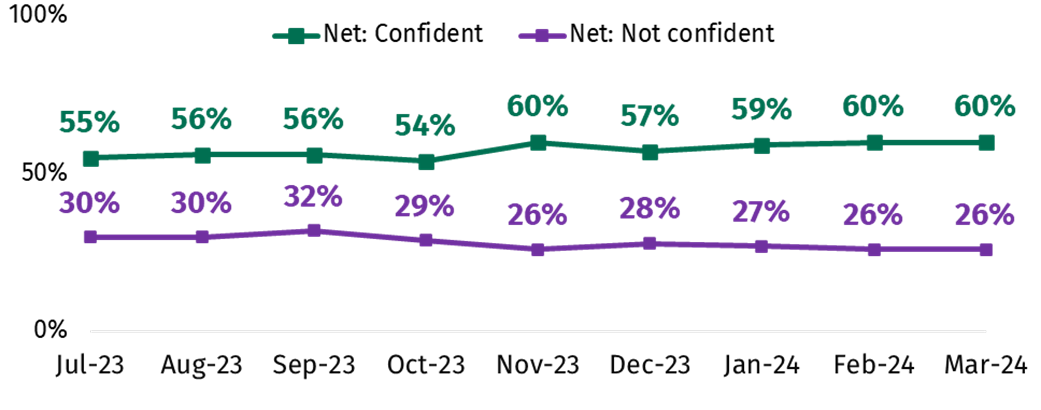
- Overall confidence in the food supply chain has increased gradually from 55% in July 2023 to 60% in March 2024. Those with lower levels of confidence in the food supply chain report higher levels of concern about all food-related issues asked about in the survey.
Trust and confidence in the FSA
- Among those with some knowledge of the FSA and what it does, the proportion that trust the FSA to do its job has fluctuated slightly across the tracking period, increasing from 55% in December 2023 to now stand at 61% as of March 2024. The proportion with confidence in the FSA’s ability to carry out its functions was slightly higher than this. For example, two in three (66%) were confident that the FSA is committed to communicating openly with the public about food-related risks in March 2024.
- Those with confidence in the FSA and those who trust the FSA were generally less likely to be concerned about all food-related issues asked about. For example, 36% of those who trusted the FSA were concerned about the safety of food produced in the UK vs 69% of those that distrusted the FSA.
Introduction
Background
The Consumer Insights Tracker is the FSA’s monthly survey that monitors changes in consumers’ behaviour and attitudes, and key issues in relation to food. The survey covers a range of food-related topics that are of strategic interest to the FSA. This includes consumers’ concerns about food-related issues, perceptions of the food supply chain, and attitudes and behaviours relating to food affordability and availability.
The FSA have been conducting monthly surveys with consumers since April 2020, when the FSA established the COVID-19 Tracker to monitor consumers’ attitudes and behaviour during the COVID-19 pandemic. This survey was designed to provide more regular and timely insights than the FSA’s biannual official statistic survey, Food and You 2 (F&Y2). In April 2022, the survey was renamed the Consumer Insights Tracker.
YouGov were appointed as the supplier of the Consumer Insights Tracker from July 2023. This report details findings from the 9-month tracking period between July 2023 and March 2024. Where relevant, comparisons are made to Food and You 2, as well as the previous Consumer Insights Tracker which ran from April 2022 to June 2023 (footnote 1).
Wider context
The period during which this survey took place coincides with an ongoing cost-of-living crisis in England, Wales and Northern Ireland. The cost of living has risen both in the UK and across the world since 2022. This has been driven by a range of factors, including the conflict in Ukraine and ongoing recovery from the COVID-19 pandemic.
Consumer price inflation averaged 5.2% in the first seven months of the tracking period (July 2023 – January 2024), while food price inflation was more than double that figure, at 10.7%. While the latter figure has been trending downwards, falling in each month from a peak of 19.2% in March 2023 to 4% in March 2024, it remains well above historical averages.
An additional cause of the crisis is the rise in energy bills, with an average UK household’s domestic energy bill rising to £2,592 in 2023, 13% higher than in 2022 and almost double what it was in 2021. The crisis has resulted in a 600,000 increase in those in absolute poverty (after housing costs) in the year 22/23.
Another key development relating to the wider food system is the growing discussion around ultra-processed foods (UPFs). These foods include cereals, biscuits, ham, sausages, bread and crisps (amongst others) (footnote 2). There has been a variety of media coverage on this topic debating their impact on health and nutrition, including a BBC Panorama documentary which aired in June 2023. The FSA published consumer information on UPFs in May 2024.
Method
Fieldwork for this online survey is carried out monthly among a representative sample of approximately 2,000 people aged 16+ living in England, Wales and Northern Ireland. All respondents who take part in the survey are drawn from the YouGov panel of over 400,000 active panel members who live in the UK.
The sampling approach used is quota sampling, with quotas taken from the 2021 Census. The sample for each wave is representative of the England, Wales and Northern Ireland population by the following variables: age, gender, social grade, region and education level. A sample boost is also applied in Northern Ireland (achieving 100 respondents each month), to improve the representation of this group and to enable rudimentary demographic comparisons between countries. Once fieldwork has been completed, weighting is applied so that the sample more accurately reflects the demographics of the target population.
Full details of the methodology used for the Consumer Insights Tracker can be found in the Technical Report.
Notes for interpretation
Data in this report comes from March 2024 unless specified, with a sample size of 2,015. In certain incidences, data is reported based on the first three months of 2024 combined, in order to facilitate analysis with greater sample sizes. The sample size in this case is 6,119.
Throughout the report, results are reported for each topic at the overall level, before differences across key demographic groups and changes over time are noted. Changes over time, or between demographic groups, are only reported when they are statistically significant using t-tests at p<0.05. This helps to ensure that only ‘true’ shifts in behaviour and attitudes are focused on in the report (i.e. they are less than 5% likely to be a result of chance). Key demographic variables analysed throughout this report include gender, age, ethnicity, region, whether there is a child aged under 18 living in the household, household size, whether the person is limited by a health condition or disability and the Index of Multiple Deprivation (IMD) decile (see further information in the Annex).
It should also be noted that there are some limitations of the online methodology used as part of this survey. For example, panel members on opt-in panels may be more engaged in current issues, which means they are more motivated to opt-into panel surveys. This means measures for some attitudes and behaviours may not truly reflect the total population. Additionally, some groups are underrepresented in online opt-in panels, for example those who do not have internet access or who are not comfortable going online, who also tend to be older and in lower socio-economic groups.
YouGov’s large nationwide panel which the survey sample is drawn from acts to mitigate these impacts, by enabling data to be gathered that is representative of the population in England, Wales and Northern Ireland across a range of demographic characteristics. In addition, the online methodology helps to reduce certain forms of bias (such as social desirability bias) compared to alternative survey methods, which can ensure that results better reflect people’s true behaviours and beliefs.
Further information about the research strengths and limitations are available in the Technical Report.
Consumer concerns about food
What were consumers most concerned about in relation to food?
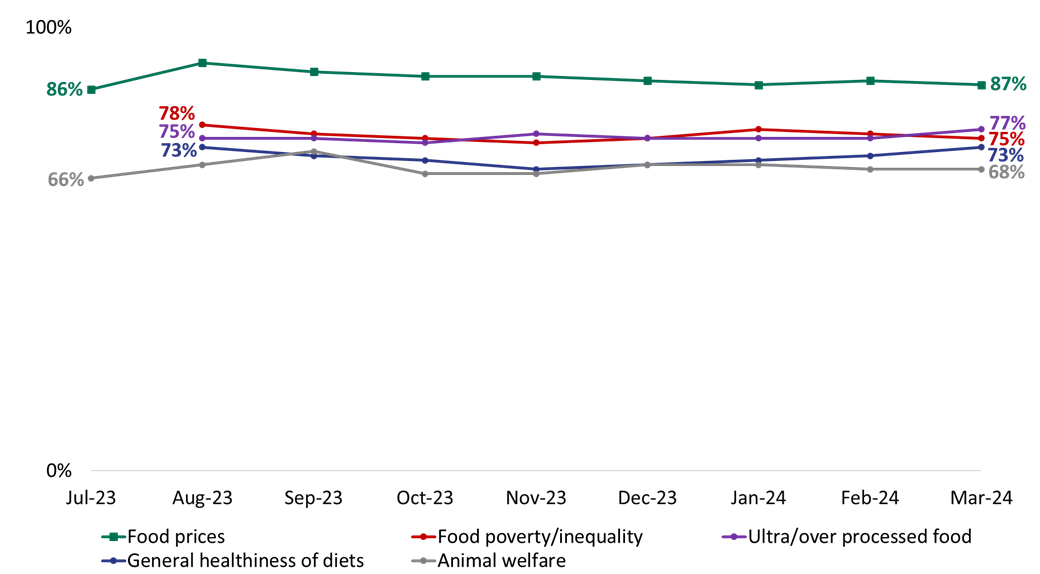
When prompted with a number of different issues related to food in the UK, the issue the highest number of consumers were concerned about was food prices (87% in March 2024), followed by ultra-processed, or the over-processing, of food (77%) and food poverty and inequality (75%). The next most commonly reported concerns were around the healthiness of people’s diets in general (73%) and animal welfare within the food industry (68%) (footnote 1).
Concern about food prices was also the most common concern in the previous year of the Consumer Insights Tracker and has been a top concern in Food and You 2 over recent waves, highlighting its pertinence as an issue over time.
As can be seen in Figure 1, the top concerns have remained relatively stable over time. For each of the top issues, concern in March 2024 is no more than 3 percentage points higher or lower than in July/August 2023 when tracking began. Concern for food prices has seen the largest variation (from a low of 86% in July 2023 to a high of 92% in August 2023) though it is worth noting this is a minimal difference (in terms of the percentage point difference).
Figure 1. General concern for food issues in the UK over time (footnote 2)
Who was most concerned about food prices?
Concern for food prices was high across the board. Whilst there were some differences by demographic group, these tended to be minimal and for all groups reported concerned was above 80%. For example, whilst concern was higher among those with household incomes of <£20k (90%) or between £20k-£35k (93%), this was not much higher than those with a household income of £35k-60k (87%) or more than £60k (82%). This same pattern has been seen since July 2023.
Who was most concerned about food poverty and inequality?
Concern about food poverty and inequality was generally high, though it was particularly high for:
- Women (80% vs. 70% of men)
- Those in the younger or middle age brackets (78% of 16-34 year olds and 79% of 35-54 year olds vs. 69% of those aged 55+)
- Those from ethnic minority backgrounds (84% vs. 74% of White respondents)
- Those with higher educational attainment (84% of those with a degree, masters or PhD vs. 68% of those with no formal qualifications)
There were not differences in levels of concern by measures of income such as social grade, gross household income or IMD.
Who was most concerned about ultra-processed or the over-processing of food?
Whilst concern for ultra-processed food was high across all demographic groups, it was particularly high for:
- Those in the middle and older age brackets (80% of 35-54 year olds and 82% of those aged 55+ vs. 69% of 16-34 year olds)
- Those in higher social grades (81% of AB and 80% of C1 vs. 72% of C2 and 74% of DE)
- Those who know a lot or a little about the FSA (84% vs. 62% of those who haven’t heard of FSA)
There were not big differences by nation, though concern regarding ultra-processed food was marginally higher in Northern Ireland (78%) and England (76%) than in Wales (72%). (footnote 3)
There was also relatively high concern around ingredients and additives in food (68%) and genetically modified (GM) food (55%). The patterns by age, with higher concern among those in the middle and older age brackets, also existed when considering the ingredients and additives in food and GM food.
Household food affordability
In addition to being asked how concerned they were about a range of food-related issues, including food prices, respondents were asked about their level of worry regarding food affordability for themselves/their household in the next month.
How have worries about food affordability changed over time?
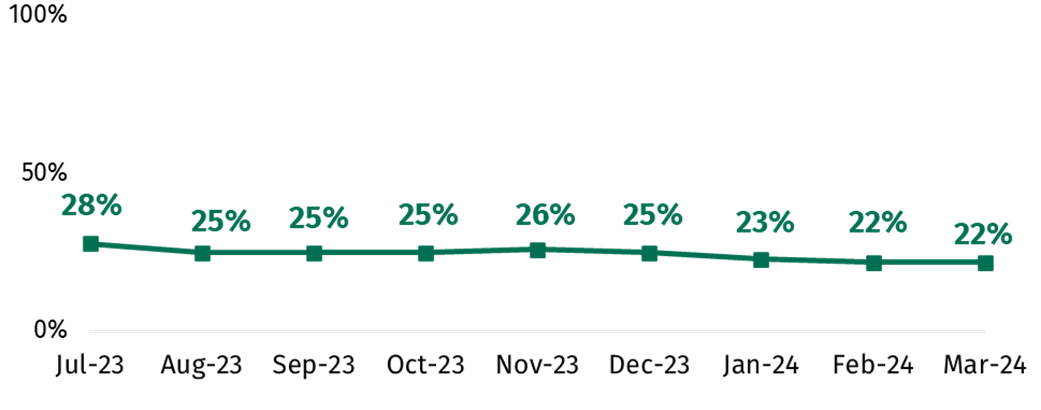
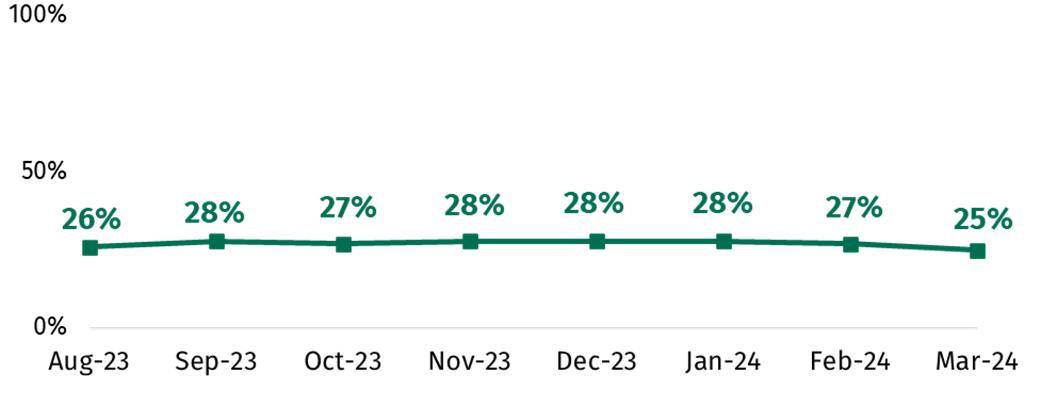
The proportion saying that they were worried about their household’s ability to afford food in the next month has declined gradually across the tracking period, falling from a peak of 28% in July 2023 to a low of 22% in February and March 2024 (Figure 2). This suggests that fewer people were worried about food affordability specifically related to their own household compared to general concerns about food prices in the UK, although this is still something around one in four people are worried about.
Figure 2. Worry about food affordability over time (footnote 4)
Who was most impacted by food affordability worries?
Groups most likely to report being worried about food affordability included those limited by a disability or long-term health condition, those aged under 55, those in the most deprived IMD deciles, those from ethnic minority backgrounds and those living in Northern Ireland. As shown in Figure 3 below, these groups were more likely to report being worried about their household’s ability to afford food in the next month. While the results shown in Figure 3 are for March 2024, these gaps were consistent across months. Differences in comparison to July 2023 (in percentage points) are shown as numbers next to the bars.
Figure 3. Concern about food affordability among key demographic groups (footnote 5)
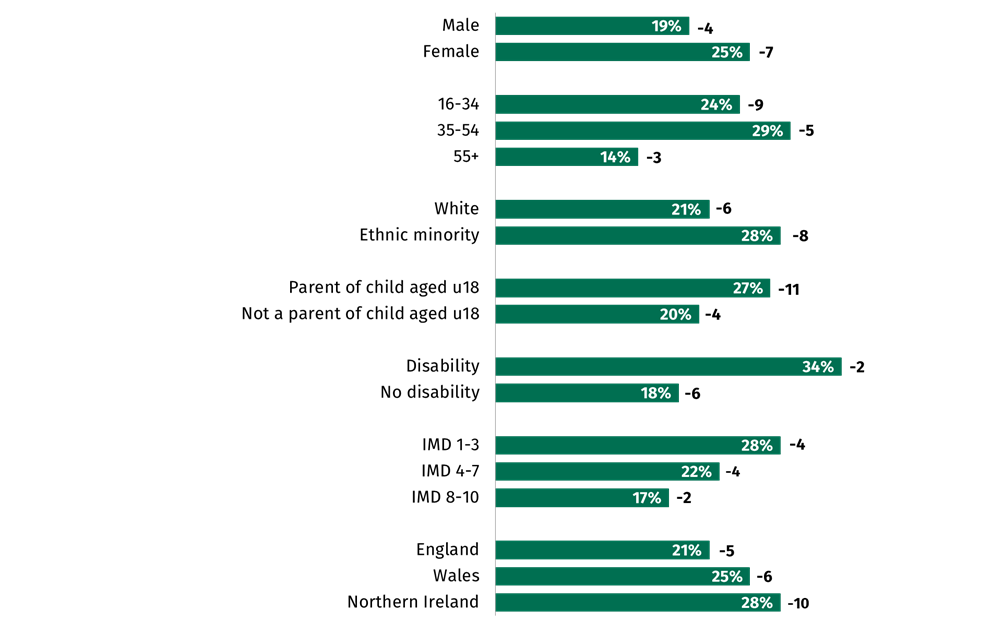
Note: Difference vs. July 2023 noted beside each group.
While levels of worry about food affordability declined across the tracking period among almost all demographic groups, these declines were larger among the groups reporting higher levels of initial worry about food affordability. This may indicate that these groups are somewhat more sensitive to changing economic conditions over time, with their levels of worry fluctuating more widely in line with changes in food prices and other cost-of-living challenges. The only exception here was among those limited by a long-term health condition or disability, for whom worries about food affordability remained higher and broadly unchanged from July 2023 - March 2024.
How have food shopping behaviours changed in response to the rising cost of living?
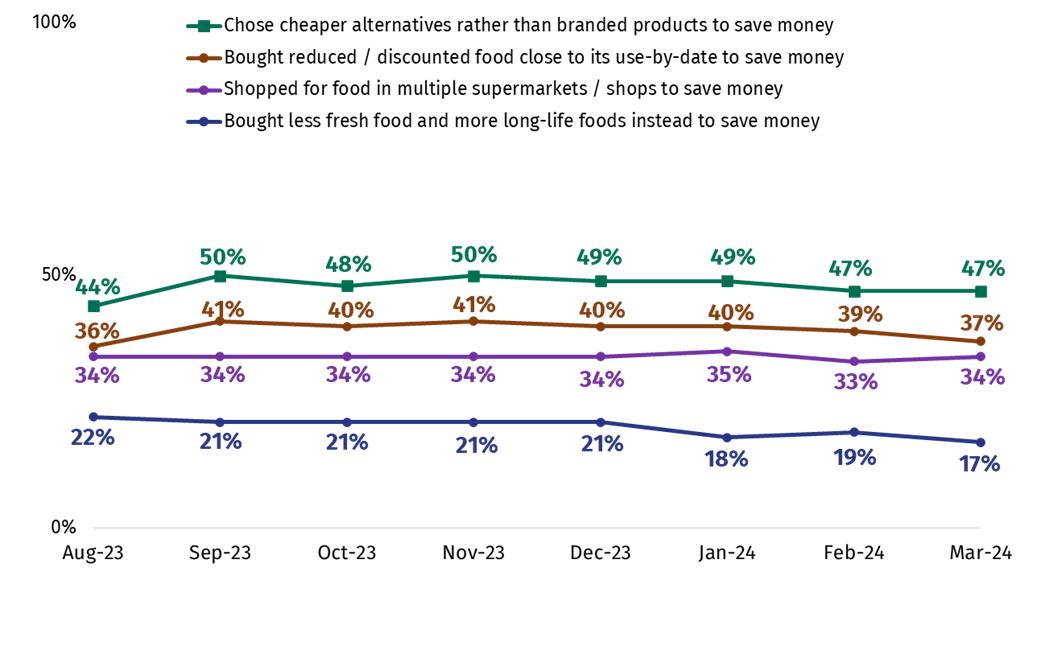
The most common ways of saving money when food shopping were choosing cheaper alternatives rather than branded products (47%), buying reduced/discounted food close to its use-by date (37%) and shopping around in multiple shops (34%), while 17% mentioned buying less fresh foods and more long-life foods instead. As can be seen in Figure 4, apart from an increase in the proportions reporting doing each of these things between August and September 2023, their incidence has remained stable across the tracking period.
Figure 4. Most common shopping behaviours over time (footnote 6)
It was less common for people to report being unable to afford their essential food shopping in general; four percent reported this in March. A slightly higher figure said they could not afford to buy food that meets their animal welfare or environmental values (6% in March 2024), though this has declined slightly from a high of 8% in September 2023.
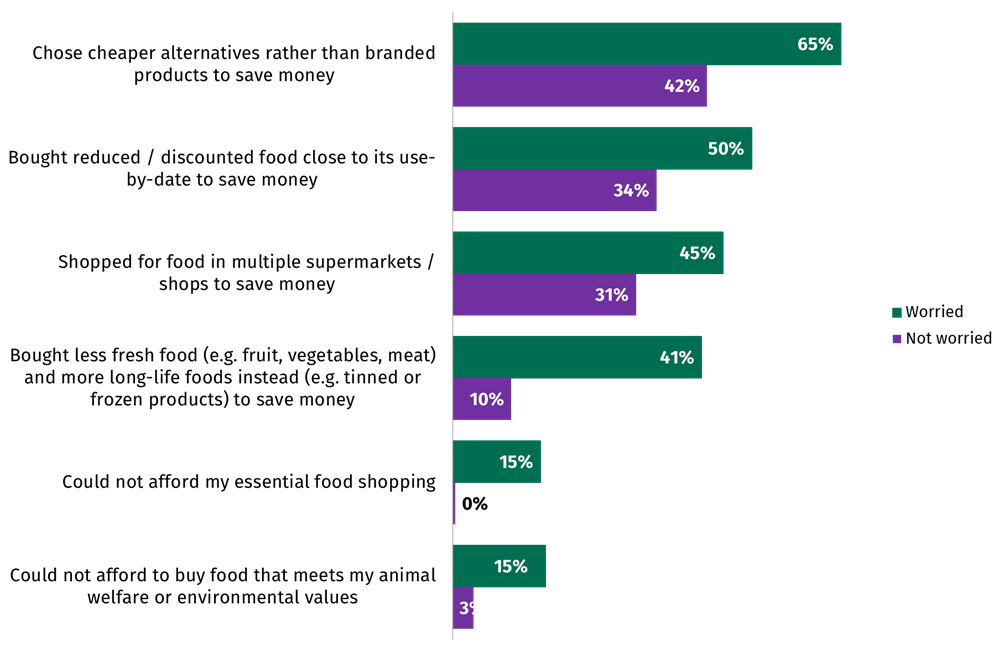
Those who were worried about their household’s ability to afford food in the next month were more likely to report making changes to their shopping behaviours to save money (Figure 5). They were also more likely to report having been unable to afford their essential shopping in the last month. These trends were consistent over time.
Figure 5. Shopping behaviours by level of worry about food affordability (footnote 7)
How have cooking and eating behaviours changed in response to the rising cost of living?
Across the survey, the most common way of reducing costs when cooking or eating was using cheaper cooking methods (e.g. using a hob, a microwave, air fryer or slow cooker) instead of an oven to heat or cook food (55%), followed by cooking/preparing food from scratch, rather than buying it (37%); both of these figures have stayed broadly stable across survey waves. Bulking out meals with cheaper ingredients was mentioned by 17%, while eating food past its use-by date, cutting the size of meals/skipping meals and being unable to afford to eat a healthy balanced diet were all reported by 9% in March 2024.
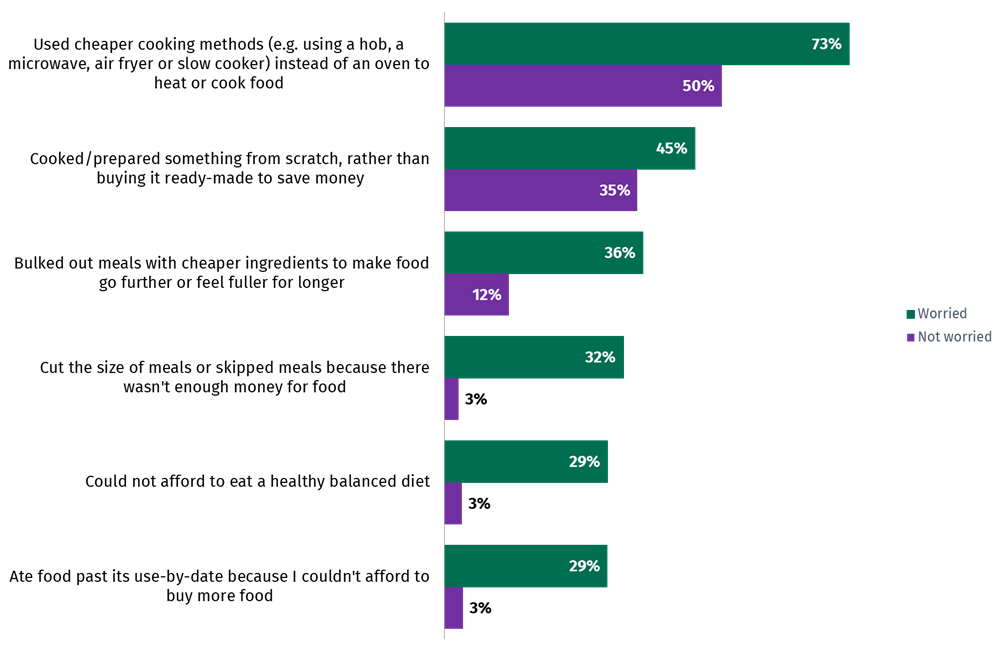
As was the case with shopping behaviours, those who were worried about food affordability were more likely to report that the statements above applied to them (Figure 6). Around three in ten (29%) of those who were worried about food affordability reported eating food past the use-by date because they couldn’t afford to buy more food in the last month, whereas only 3% of those who weren’t worried about food affordability reported doing this. These trends were again consistent over time and hold when analysing demographic differences, with the groups most worried about food affordability consistently more likely to report that these behaviours apply to them.
Figure 6. Cooking and eating behaviours by level of worry about food affordability (footnote 8)
Has trying to save money led people to practice risky food behaviours?
Respondents were asked whether they had taken a number of food-related actions in the last month in order to reduce their energy bills and save money. Specifically, the actions listed aimed to measure the prevalence of certain ‘risky’ food-related behaviours. These included reducing the length of time food is cooked for; lowering the cooking temperature for food; turning off a fridge/freezer containing food; changing fridge/freezer settings to a warmer temperature; or eating food past its use-by date.
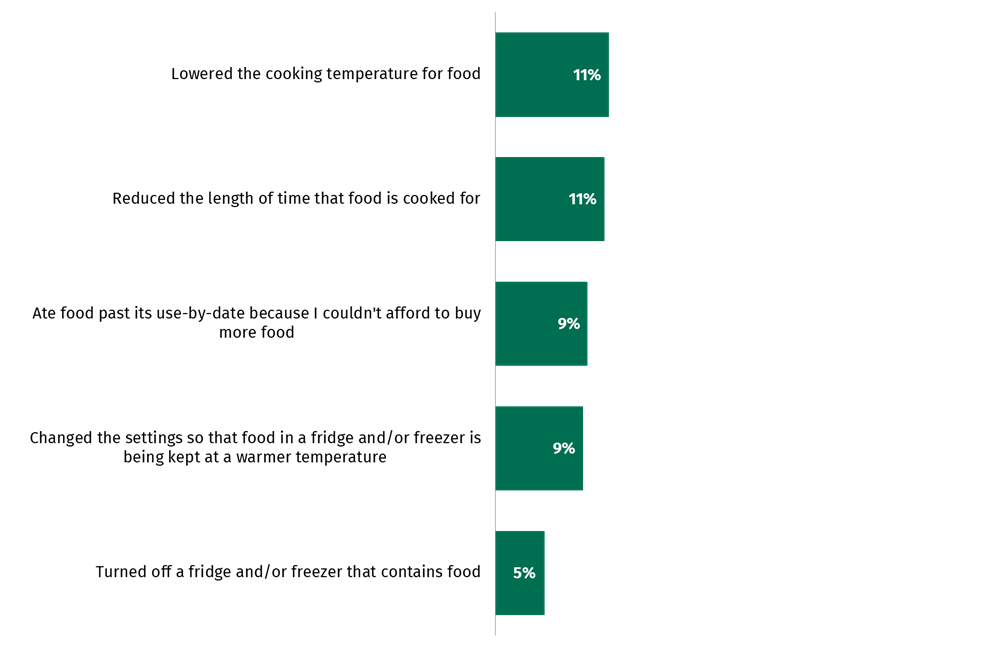
As can be seen in Figure 7, the proportion reporting having done each of these in the last month was relatively low. In March 2024, 11% reported lowering the cooking temperature for food and the same proportion said this about reducing the length of time food is cooked for. Less than one in ten mentioned eating food past its use-by date (9%), keeping their fridge/freezer at a warmer temperature (9%) or turning off a fridge/freezer that contained food (5%) in order to save money. Again, these figures remained broadly steady across the 9-month period.
Figure 7. Proportion reporting each risky food behaviour (footnote 9)
However, one in four (25%) of those in England, Wales and Northern Ireland reported they have done at least one ‘risky’ food behaviour in the last month as of March 2024 (Figure 8), a figure which has remained broadly stable across survey waves. Those worried about food affordability (58%) were much more likely to report doing these than those not worried (15%), indicating that these methods are used quite frequently by some in order to save money. Those from an ethnic minority background (39%), those limited by a health condition or disability (35%), those in the most deprived IMD deciles (34%), and those aged under 35 (30%) were also more likely to report these kinds of behaviours. These trends were consistent across the tracking period.
Figure 8. Proportion reporting at least one risky food behaviour in the last month (footnote 10)
These included reducing the length of time food is cooked for; lowering the cooking temperature for food; turning off a fridge/freezer containing food; changing fridge/freezer settings to a warmer temperature; or eating food past its use-by date.
How has food bank usage changed over the last 8 months?
The proportion who reported that they or someone in their household had received a free parcel of food from a food bank or emergency food provider has remained broadly comparable, at between 2-4% across the 9-month tracking period (Figure 9).
Figure 9. Proportion reporting using a food bank in the last month (footnote 11)
The relatively low incidence of food bank usage makes it more difficult to detect statistically significant differences across demographic groups for individual months. However, combining the data for the first three months of 2024 revealed the following trends in usage:
- One in twenty (5%) of those in the most deprived IMD deciles reported using a food bank in the last month, compared to 1% of those in the least deprived deciles
- The same proportion (5%) of those limited by a health condition or disability reported using a food bank in the last month, compared to 2% of those not limited
- 5% of those with children under 18 living in their household had used a food bank, compared to 2% without children under 18 living in their household
- Food bank usage rises with household size; 5% of those in households with 4 or more people have used one in the last month, compared to 2% with 1-3 people
- Usage was three times higher among those from an ethnic minority background than White respondents (6% vs. 2%)
- Usage was higher in Wales (5%) than in England or Northern Ireland (both 3%). It was also higher in London (6%).
Food availability
How have worries about food availability changed over the last 9 months?
The proportion who said that they were worried about there not being enough food available for them (or their household) has slowly declined since July 2023 (24%), though has been generally stable across the tracking period. This can be seen in Figure 10. This means the majority were either not very or not at all worried about this in March 2024 (78%).
Figure 10. Worry over food availability over time (footnote 12)
Who was most worried about food availability?
Groups most worried about food availability include:
- Those in the younger and middle age brackets (23% of 16-34 year olds and 25% of 35-54 year olds vs. 12% of those aged 55+)
- Those from ethnic minority backgrounds (30% vs. 18% of those from White backgrounds)
- Those in the lowest income bracket (33% of those with a household income of <£20k vs. 12% of those with a household income of £60k or more)
- Those limited a lot by a health condition or disability (42% vs. 16% of those who are not limited)
Confidence in the food supply chain
How has confidence in the food supply chain changed over time?
Overall confidence in the food supply chain has increased gradually from 55% in July 2023 to 60% in March 2024. The proportion who said they are not confident declined by four percentage points during the same period, from 30% to 26%. This can be seen in Figure 11.
This confidence was particularly driven by perceptions of food safety, availability and quality. Three in four (73%) said that they were confident that those involved in the food supply chain ensure that food is safe to eat, while 59% said this about there being enough food available to eat, and 56% that they ensure food is of high quality. Levels of confidence relating to availability and safety rose marginally by 3 and 4 percentage points, respectively, from July 2023 to March 2024, while for quality this figure remained steady.
Confidence was lower when it comes to food affordability, with only 39% saying that those involved in the food supply chain ensure that there are affordable food options for everyone, compared to 52% who were not confident. Lower levels of confidence in this aspect of the supply chain are likely a reflection of people’s general concerns about food prices in the UK.
Figure 11. Confidence in the food supply chain over time (footnote 13)
Which groups expressed the lowest levels of confidence in the food supply chain?
The groups most likely to say they are not confident in the food supply chain included:
- Those limited by a health condition or disability (31%), compared to 25% of those who are not limited
- Those in urban areas (27%), compared to 22% in rural areas
- Those in Wales (32%), compared to 29% in England and 26% in Northern Ireland
Trust and confidence in the FSA
How many people reported knowing about the FSA?
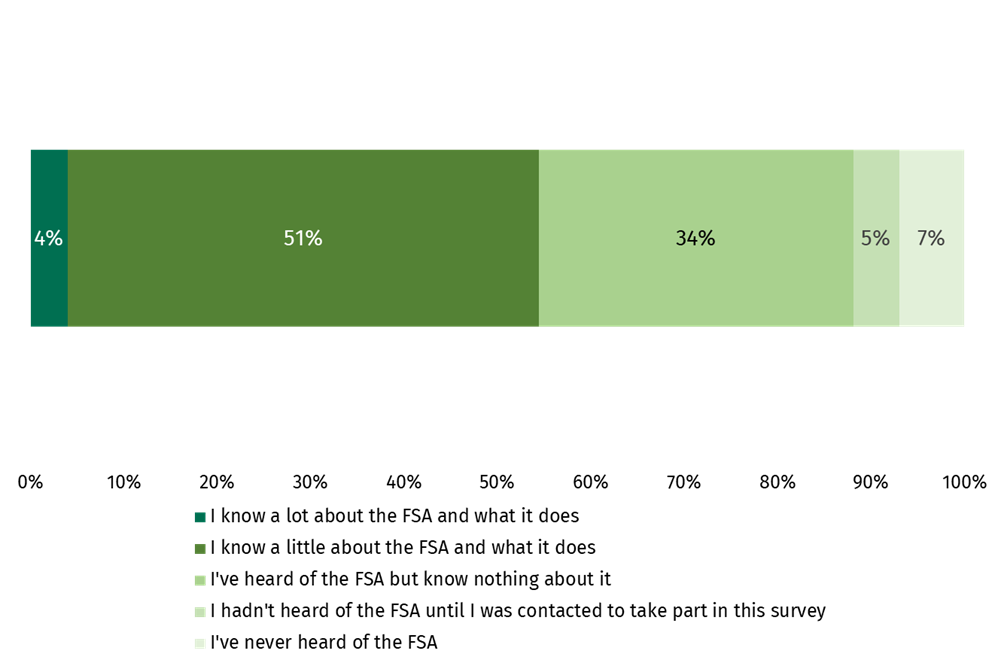
Over half (55%) said they have at least some knowledge of the FSA, although the majority of this figure was made up of people who said they know ‘a little’ (51%), compared to just 4% who said they know ‘a lot’ (Figure 12). An additional 34% reported that they had heard of the FSA but know nothing about it, meaning that awareness of the organisation was 89% overall in March. These figures were unchanged across the tracking period.
Figure 12. Knowledge of the FSA (footnote 14)
Self-reported knowledge of the FSA was higher among certain groups, including those aged 55+ (63% vs. 59% of those aged 35-54 and 40% of those aged under 35), white respondents (56% vs. 45% from an ethnic minority background), those in social grade AB (61% vs. 50% in DE), parents of children under 18 (57% vs. 51% of those without children) and those limited by a disability or long-term health condition (57% vs. 51% of those not limited).
For the remainder of this section on trust, analysis is filtered to only include those with some knowledge of the organisation (footnote 15), as it is adjudged that this is a more reliable measure for tracking trust over time.
How has trust in the FSA changed over time?
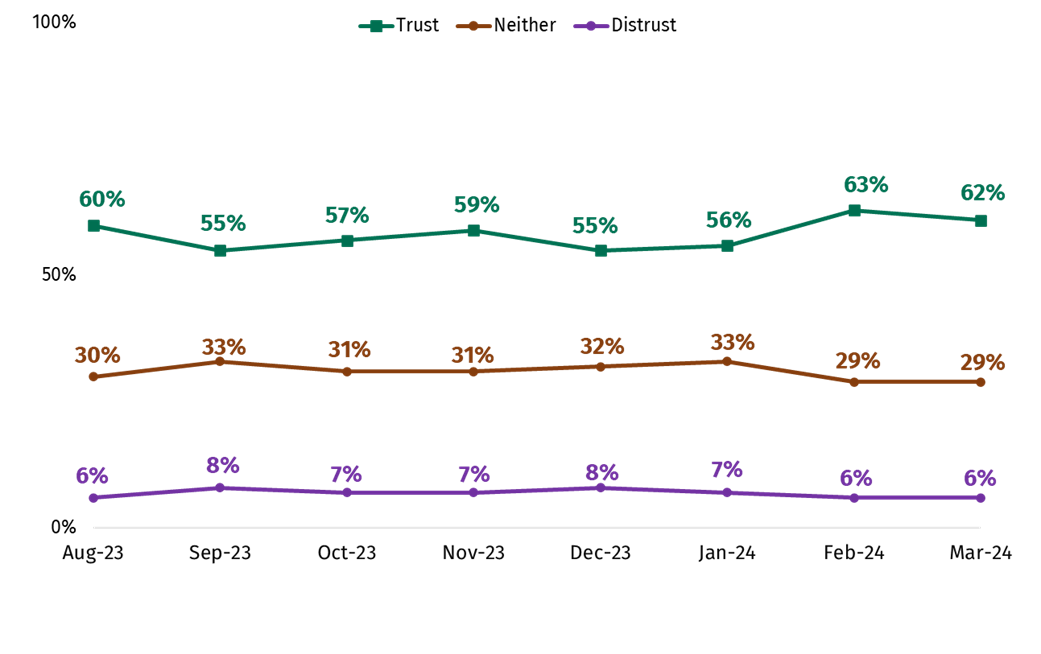
Among those with some knowledge of the FSA and what it does, trust in the organisation has fluctuated across the tracking period. As Figure 13 below shows, the proportion that trust the FSA to do its job has increased from its most recent low of 55% in December 2023 to 62% as of March 2024. The proportion who reported that they do not trust the FSA was between 6% and 8% across this period; this means that any changes in overall trust were partially a result of more people saying they ‘neither trust nor distrust’ the FSA, which was at 29% in March 2024.
Figure 13. Trust in the FSA over time (among those who have some knowledge about the FSA) (footnote 16)
How confident were people in the FSA’s ability to carry out its functions?
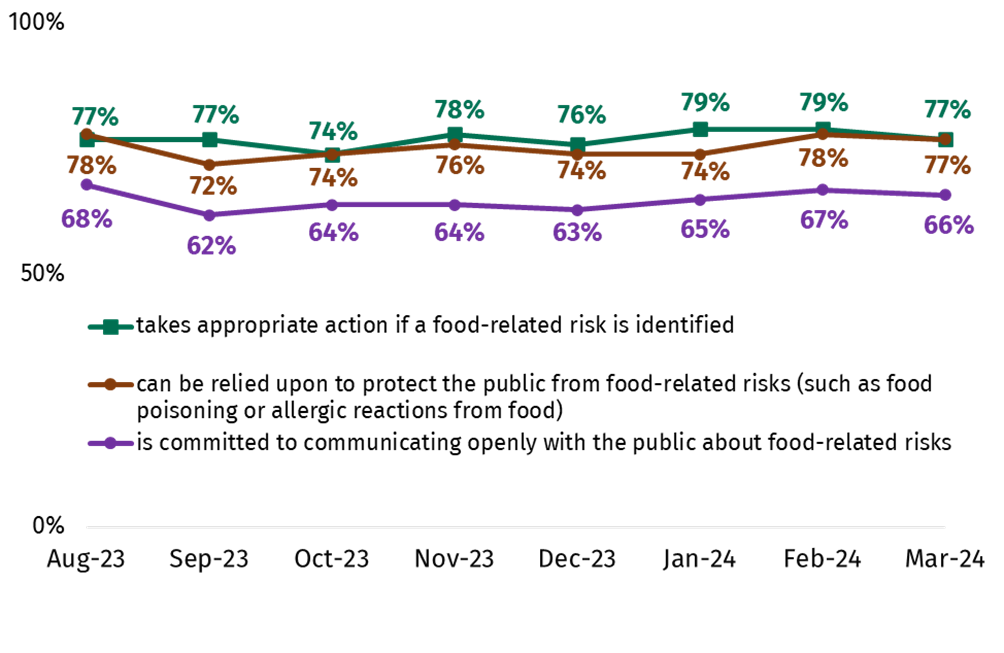
Overall, there was high confidence in the FSA’s ability to carry out its functions. In terms of the functions the FSA carries out, 77% were confident that it can be relied upon to protect the public from food-related risks, while the same proportion were confident that it takes appropriate action regarding food-related risks (77%). Both of these figures have remained stable across the tracking period since August 2023 (Figure 14).
Confidence that the FSA is committed to communicating openly with the public about food-related risks was somewhat lower, though remains a majority at 66%. This figure has again remained stable since last August.
Figure 14. Confidence in various FSA functions over time (among those who have some knowledge of the FSA) (footnote 17)
Do those who trust the FSA have more or less concerns about food?
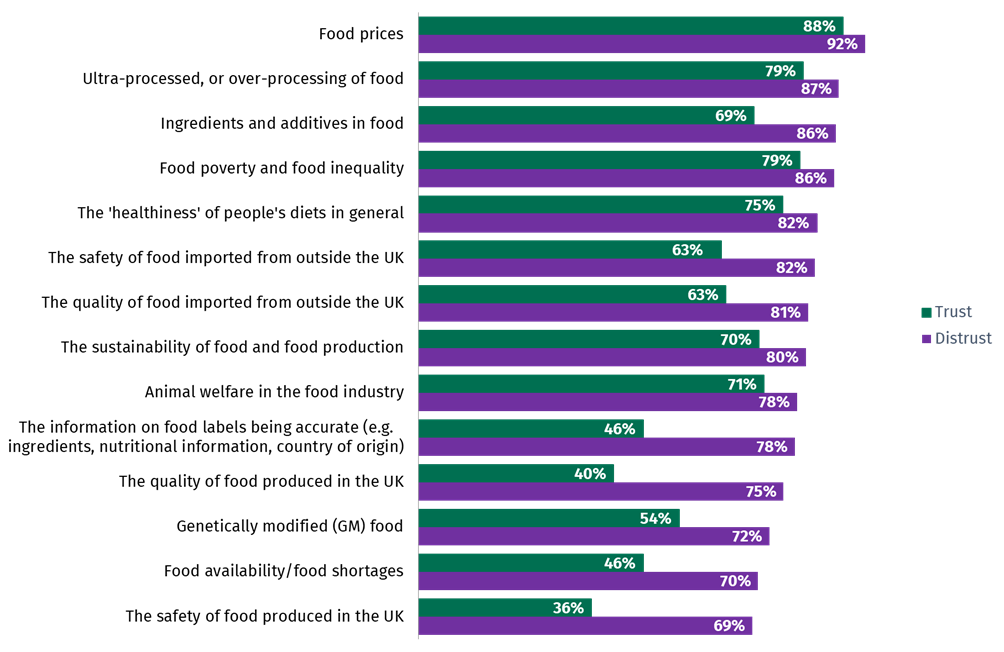
Those who trust the FSA were generally less likely to be concerned about all food-related issues asked about, compared to those who did not trust the FSA. The issues where there were the largest differences in the level of concern between those who trusted and distrusted the FSA were the safety of food produced in the UK (69% vs. 36%), as well as its quality (75% vs. 40%), while similar differences were also seen when it comes to food imported to the UK (footnote 18). As Figure 15 below shows, those who distrust the FSA were also more likely to be concerned about ultra-processed food, ingredients and additives in food and GM food, as well as the accuracy of food labelling. (footnote 19)
Figure 15. Concerns about food in the UK by trust in the FSA (footnote 20)
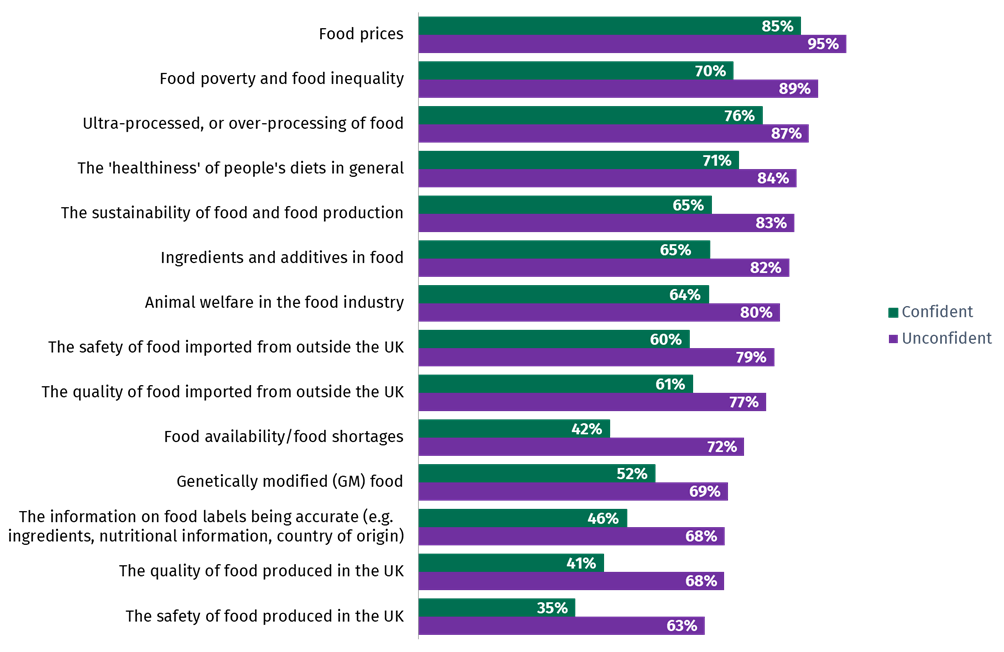
A similar pattern was observed when comparing concerns by level of confidence in the food supply chain, as can be seen in Figure 16 below.
Figure 16. Concerns about food in the UK by confidence in the food supply chain (footnote 21)
Which groups expressed lower levels of trust in the FSA?
The proportions who said they distrust the FSA were low with few notable differences between demographic groups. However, there were some groups less likely to say they trust the organisation, including:
- Women (56%), compared to 67% of men
- Those aged 35-54 (57%) and those aged 55+ (59%), compared to 74% of those aged under 35
- Those limited by a health condition or disability (53%), compared to 65% of those who are not limited
-
The survey prompted respondents with a list of 14 different food related concerns (e.g. including food availability/shortages and the safety and quality of food and food labelling) and asked them how concerned, if at all, they were about each of them.
-
[Q12] Thinking about food in the UK in general. At the moment, how concerned, if at all, do you feel about each of the following topics? Base: All in March 2024 (n=2,015), February (n=2,066), January (n=2,038), December (n=2,026), November (n=2,064), October (n=2,062), September (n=2,057), August (n=2,044) and July 2023 (n=2,085).
-
Due to small base sizes in Northern Ireland and Wales each wave, data at the nation level has been rolled up for the past 3 months (January – March 2024).
-
[Q3m] To what extent, if at all, are you worried you/your household will not be able to afford food in the next month? Base: All in March 2024 (n=2,015), February (n=2,066), January (n=2,038), December (n=2,026), November (n=2,064), October (n=2,062), September (n=2,057), August (n=2,044) and July 2023 (n=2,085).
-
[Q3m] To what extent, if at all, are you worried you/your household will not be able to afford food in the next month? Base: All male (n=993), female (n=1,022), 16-34 (532), 35-54 (636), 55+ (847), White (1,795), Ethnic minority (185), child aged under 18 in household (570), no child aged under 18 in household (1,394), disability/limiting health condition (559), no disability/limiting health condition (1,431), IMD 1-3 (521), IMD 4-7 (808), IMD 8-10 (686), England (1,811), Wales (100), Northern Ireland (104) in March 2024.
-
[Q6] In the last month, did any of the following apply to you, or someone else in your household? Base: All in March 2024 (n=2,015), February (n=2,066), January (n=2,038), December (n=2,026), November (n=2,064), October (n=2,062), September (n=2,057), August (n=2,044) and July 2023 (n=2,085).
-
[Q6] In the last month, did any of the following apply to you, or someone else in your household? Base: All worried (n=434) and not worried (n=1,549) about food affordability in March 2024.
-
[Q6] In the last month, did any of the following apply to you, or someone else in your household? / [Q8m] In the last month, which, if any, of the following have you done to reduce your energy bills and save money? (Used cheaper cooking methods (e.g. using a hob, a microwave, air fryer or slow cooker) instead of an oven to heat or cook food). Base: All worried (n=434) and not worried (n=1,549) about food affordability in March 2024.
-
[Q8m] In the last month, which, if any, of the following have you done to reduce your energy bills and save money? / [Q6] In the last month, did any of the following apply to you, or someone else in your household? (Ate food past its use-by date because I couldn’t afford to buy more food) Base: All in March 2024 (n=2,015).
-
[Q8m] In the last month, which, if any, of the following have you done to reduce your energy bills and save money? / [Q6] In the last month, did any of the following apply to you, or someone else in your household? (Ate food past its use-by date because I couldn’t afford to buy more food). Base: All in March 2024 (n=2,015), February (n=2,066), January (n=2,038), December (n=2,026), November (n=2,064), October (n=2,062), September (n=2,057) and August 2023 (n=2,044).
-
[Q3] In the last month, have you or anyone else in your household received a free parcel of food from a food bank or other emergency food provider? Base: All in March 2024 (n=2,015), February (n=2,066), January (n=2,038), December (n=2,026), November (n=2,064), October (n=2,062), September (n=2,057) and August 2023 (n=2,044).
-
[Q2m] To what extent, if at all, are you worried about there not being enough food available for you/your household to buy in the next month? Base: All in March 2024 (n=2,015), February (n=2,066), January (n=2,038), December (n=2,026), November (n=2,064), October (n=2,062), September (n=2,057), August (n=2,044) and July 2023 (n=2,085).
-
[Q13] How confident are you in the food supply chain? That is all the processes involved in bringing food to your table. Base: All in March 2024 (n=2,015), February (n=2,066), January (n=2,038), December (n=2,026), November (n=2,064), October (n=2,062), September (n=2,057), August (n=2,044) and July 2023 (n=2,085).
-
[Q14a] How much, if anything, do you know about the Food Standards Agency? Base: All in March 2024 (n=2,015).
-
Those who said they know ‘a lot’ or ‘a little’ about the FSA and what it does
-
[Q16] The Food Standards Agency is the Government Agency responsible for food safety in England, Wales and Northern Ireland. How much do you trust or distrust the Food Standards Agency to do its job? That is to make sure that food is safe and what it says it is. Base: All with some knowledge about the Food Standards Agency in March 2024 (n=1,137), February (n=1,127), January (n=1,168), December (n=1,134), November (n=1,183), October (n=1,175), September (n=1,161) and August 2023 (n=1,126).
-
[Q15] The Food Standards Agency is the Government Agency responsible for food safety in England, Wales and Northern Ireland. How confident are you that the Food Standards Agency... Base: All with some knowledge about the Food Standards Agency in March 2024 (n=1,137), February (n=1,127), January (n=1,168), December (n=1,134), November (n=1,183), October (n=1,175), September (n=1,161) and August 2023 (n=1,126).
-
These figures are from January to March 2024
-
Due to small base sizes for those who distrust the FSA within individual months, figures here are based on three months of data from January-March 2024.
-
[Q12] Thinking about food in the UK in general. At the moment, how concerned, if at all, do you feel about each of the following topics? Base: All with some knowledge about the Food Standards Agency who trust (n=2,047) and distrust (n=247) it from January-March 2024.
-
[Q12] Thinking about food in the UK in general. At the moment, how concerned, if at all, do you feel about each of the following topics? Base: All confident (n=1,225) and not confident (n=529) in the food supply chain in March 2024.
Discussion
One of the key findings from this report is that the cost of buying food continues to be a top concern for consumers. In the context of the ongoing cost of living crisis and high levels of food price inflation, food prices were consistently the topic most consumers were concerned about, while food poverty and inequality ranked as the second or third concern in every wave. This suggests that concerns relating to food costs and affordability are top of mind for consumers, with the data from this survey indicating that this has a knock-on effect on cooking and eating behaviours. Although levels of worry about their own household’s ability to afford food were lower, and declined slightly throughout the tracking period, there remained a sizeable minority (approximately one in five) reporting this. Worries relating to household food affordability were particularly apparent for those aged under 55, those in the most deprived IMD deciles, those limited by a health condition or disability, and those with children in their household.
People reported making a number of changes to their shopping, cooking and eating behaviours to save money. While some of these changes, such as buying cheaper alternatives to branded products or cooking from scratch rather than buying ready-made, are less of a cause for concern, sizeable proportions also reported taking actions which are more of a concern, such as eating food past its use-by date, lowering the cooking temperature for food, or reducing the length of time food is cooked for. Those worried about food affordability were much more likely to report practicing these kinds of ‘risky’ food behaviours, suggesting a link between purchasing power and food safety. Overall, these findings indicate that financial pressures in the context of the cost of living crisis and food price inflation might be driving some to engage in unsafe food behaviours to save money.
Concerns about the healthiness of people’s diets, including ultra-processed or over-processing of food, also ranked highly within this research. Concern with these issues associated with other issues, such as GM foods or ingredients/additives in food. In contrast to food affordability, concerns about these issues tended to be higher among older age groups. This highlights the importance of ensuring that the needs and preferences of all age groups, especially the older demographic, are addressed in communication and educational campaigns about these issues.
The proportion who said that they were worried about there not being enough food available for their household was also relatively low, although still around 1 in 5 were worried about this. However, when considering those involved in the food supply chain, most respondents were confident that they ensure there is enough food available. Confidence in the food supply chain was lowest when it comes to the perception that those involved in the food supply chain ensure that there are affordable food options for everyone. This again suggests food affordability is a key issue and area of concern for consumers.
A majority reported trust in the FSA, while there was also high confidence in the FSA’s ability to carry out its functions. Those who trusted the FSA were generally less likely to be concerned about all food-related issues asked about, compared to those who did not trust the FSA. Caution should be taken when analysing the relationship between these perceptions. For example, it may be that those with lower levels of concern about food-related issues tend to trust institutions related to the food system more, as opposed to higher levels of trust in the FSA driving lower levels of concern.
Annex
Definitions
Definitions of the IMD and social grade are provided below.
The Index of Multiple Deprivation (IMD) is calculated using country-specific metrics (domains of deprivation), such as income, barriers to housing and services and crime, which are combined to give an overall measure of relative deprivation within a respondent’s specific output area. These output areas are then ranked and within the report are grouped so that comparisons are made between those in the most deprived (1-3), middle (4-7) and least deprived (8-10) IMD deciles.
- England: The IMD ranks each English LSOA (Lower layer Super Output Areas) from 1 (most deprived) to 32,844 (least deprived)
- Wales: The Welsh equivalent (WIMD; Welsh Index of Multiple Deprivation) ranks each Welsh LSOA from 1 (most deprived) to 1,909 (least deprived)
- Northern Ireland (NI): The NI equivalent ranks each OA (Output Area) from 1 (most deprived) to 5,022 (least deprived)
Social grade is a socio-economic metric classification which groups people into four classifications based on “the occupation of the Chief Income Earner (CIE)” of their household (footnote 1). This report compares those in social grades AB, C1, C2 and DE as classified by the National Readership Survey (NRS).
The way in which social grade is classified is listed below:
- AB: higher and intermediate managerial, administrative and professional occupations
- C1: supervisory, clerical, and junior managerial, administrative and professional occupations
- C2: skilled manual occupations
- DE: semi-skilled and unskilled manual occupations, unemployed and lowest grade occupations
-
National Readership Survey: ‘Social Grade’ (link here)